
|
Guangdong Provincial Expressway Development Co., Ltd. (200429.SZ) DCF -Bewertung |
Fully Editable: Tailor To Your Needs In Excel Or Sheets
Professional Design: Trusted, Industry-Standard Templates
Investor-Approved Valuation Models
MAC/PC Compatible, Fully Unlocked
No Expertise Is Needed; Easy To Follow
Guangdong Provincial Expressway Development Co., Ltd. (200429.SZ) Bundle
Vereinfachen Sie Guangdong Provincial Expressway Development Co., Ltd. (200429SZ) Bewertung mit diesem anpassbaren DCF -Taschenrechner! Mit Real Guangdong Provincial Expressway Development Co., Ltd. (200429SZ) Finanzdaten und einstellbaren Prognoseeingaben können Sie Szenarien testen und Guangdong Provincial Expressway Development Co., Ltd. (200429SZ) Fairwert in Minuten in Minuten aufdecken.
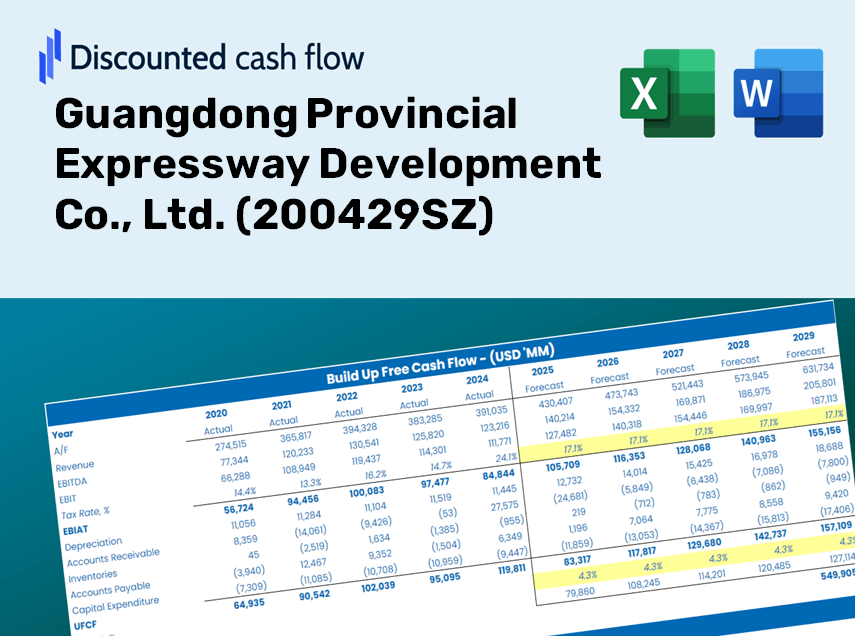
Discounted Cash Flow (DCF) - (USD MM)
| Year | AY1 2020 |
AY2 2021 |
AY3 2022 |
AY4 2023 |
AY5 2024 |
FY1 2025 |
FY2 2026 |
FY3 2027 |
FY4 2028 |
FY5 2029 |
|---|---|---|---|---|---|---|---|---|---|---|
| Revenue | 4,143.8 | 5,781.2 | 4,557.4 | 5,334.1 | 4,996.1 | 5,358.9 | 5,748.1 | 6,165.6 | 6,613.4 | 7,093.7 |
| Revenue Growth, % | 0 | 39.51 | -21.17 | 17.04 | -6.34 | 7.26 | 7.26 | 7.26 | 7.26 | 7.26 |
| EBITDA | 3,212.4 | 4,766.2 | 3,713.7 | 4,755.7 | 4,397.5 | 4,486.8 | 4,812.6 | 5,162.2 | 5,537.1 | 5,939.2 |
| EBITDA, % | 77.52 | 82.44 | 81.49 | 89.16 | 88.02 | 83.73 | 83.73 | 83.73 | 83.73 | 83.73 |
| Depreciation | 1,132.5 | 1,395.1 | 1,150.1 | 1,266.9 | 1,171.7 | 1,327.9 | 1,424.4 | 1,527.8 | 1,638.8 | 1,757.8 |
| Depreciation, % | 27.33 | 24.13 | 25.24 | 23.75 | 23.45 | 24.78 | 24.78 | 24.78 | 24.78 | 24.78 |
| EBIT | 2,079.9 | 3,371.1 | 2,563.6 | 3,488.8 | 3,225.8 | 3,158.9 | 3,388.3 | 3,634.3 | 3,898.3 | 4,181.4 |
| EBIT, % | 50.19 | 58.31 | 56.25 | 65.41 | 64.57 | 58.95 | 58.95 | 58.95 | 58.95 | 58.95 |
| Total Cash | 3,112.9 | 3,232.1 | 4,690.7 | 5,158.7 | 4,689.9 | 4,518.8 | 4,847.0 | 5,199.0 | 5,576.6 | 5,981.6 |
| Total Cash, percent | .0 | .0 | .0 | .0 | .0 | .0 | .0 | .0 | .0 | .0 |
| Account Receivables | 190.6 | 179.7 | 118.5 | 250.9 | 252.8 | 215.1 | 230.7 | 247.5 | 265.5 | 284.7 |
| Account Receivables, % | 4.6 | 3.11 | 2.6 | 4.7 | 5.06 | 4.01 | 4.01 | 4.01 | 4.01 | 4.01 |
| Inventories | .1 | .7 | .0 | .0 | .0 | .1 | .2 | .2 | .2 | .2 |
| Inventories, % | 0.00141837 | 0.01210424 | 0 | 0 | 0 | 0.00270452 | 0.00270452 | 0.00270452 | 0.00270452 | 0.00270452 |
| Accounts Payable | 404.3 | 289.2 | 216.2 | 234.4 | 247.2 | 309.2 | 331.6 | 355.7 | 381.5 | 409.2 |
| Accounts Payable, % | 9.76 | 5 | 4.74 | 4.4 | 4.95 | 5.77 | 5.77 | 5.77 | 5.77 | 5.77 |
| Capital Expenditure | -721.6 | -561.6 | -956.8 | -1,682.9 | -2,226.5 | -1,331.6 | -1,428.3 | -1,532.0 | -1,643.3 | -1,762.6 |
| Capital Expenditure, % | -17.41 | -9.71 | -20.99 | -31.55 | -44.57 | -24.85 | -24.85 | -24.85 | -24.85 | -24.85 |
| Tax Rate, % | 43.69 | 43.69 | 43.69 | 43.69 | 43.69 | 43.69 | 43.69 | 43.69 | 43.69 | 43.69 |
| EBITAT | 1,529.1 | 2,587.2 | 1,964.5 | 1,914.8 | 1,816.5 | 2,135.9 | 2,291.1 | 2,457.5 | 2,635.9 | 2,827.4 |
| Depreciation | ||||||||||
| Changes in Account Receivables | ||||||||||
| Changes in Inventories | ||||||||||
| Changes in Accounts Payable | ||||||||||
| Capital Expenditure | ||||||||||
| UFCF | 2,153.7 | 3,315.9 | 2,146.8 | 1,384.5 | 772.5 | 2,231.8 | 2,294.0 | 2,460.6 | 2,639.3 | 2,831.0 |
| WACC, % | 3.97 | 4 | 4 | 3.77 | 3.78 | 3.9 | 3.9 | 3.9 | 3.9 | 3.9 |
| PV UFCF | ||||||||||
| SUM PV UFCF | 11,069.0 | |||||||||
| Long Term Growth Rate, % | 2.00 | |||||||||
| Free cash flow (T + 1) | 2,888 | |||||||||
| Terminal Value | 151,784 | |||||||||
| Present Terminal Value | 125,342 | |||||||||
| Enterprise Value | 136,411 | |||||||||
| Net Debt | 2,669 | |||||||||
| Equity Value | 133,742 | |||||||||
| Diluted Shares Outstanding, MM | 2,091 | |||||||||
| Equity Value Per Share | 63.97 |
What You Will Receive
- Pre-Filled Financial Model: Utilize Guangdong Provincial Expressway Development Co., Ltd.'s actual data for accurate DCF valuation.
- Complete Forecast Control: Modify revenue growth, profit margins, WACC, and other essential factors.
- Real-Time Calculations: Immediate updates allow you to view results as you implement changes.
- Investor-Ready Template: A polished Excel file crafted for high-quality valuation standards.
- Customizable and Reusable: Designed for adaptability, making it suitable for multiple detailed forecasts.
Key Features
- Real-Time GDX Data: Pre-filled with Guangdong Provincial Expressway Development Co., Ltd.'s historical financials and future projections.
- Fully Customizable Inputs: Modify revenue growth rates, profit margins, WACC, tax rates, and capital expenditure estimates.
- Dynamic Valuation Model: Automatic recalculation of Net Present Value (NPV) and intrinsic value in line with your adjustments.
- Scenario Testing: Develop various forecasting scenarios to explore different valuation results.
- User-Friendly Design: Intuitive layout, structured for both industry professionals and newcomers.
How It Works
- Step 1: Download the prebuilt Excel template containing data for Guangdong Provincial Expressway Development Co., Ltd. (200429SZ).
- Step 2: Review the pre-filled sheets to familiarize yourself with the essential metrics.
- Step 3: Modify forecasts and assumptions in the editable yellow cells (such as WACC, growth rates, and margins).
- Step 4: Immediately see updated results, including the intrinsic value of Guangdong Provincial Expressway Development Co., Ltd. (200429SZ).
- Step 5: Make well-informed investment decisions or create reports based on the results obtained.
Why Select This Calculator for Guangdong Provincial Expressway Development Co., Ltd. (200429SZ)?
- Reliable Data: Access accurate financial metrics for Guangdong Provincial Expressway Development Co., Ltd. to ensure dependable valuation outputs.
- Customizable Options: Tailor essential variables such as growth rates, WACC, and tax rates to align with your specific forecasts.
- Efficiency: Built-in calculations save you time and effort, allowing you to avoid starting from the ground up.
- Professional Quality: Created with the needs of investors, analysts, and consultants in mind.
- Easy to Use: A straightforward design and clear, step-by-step guidance cater to users of all experience levels.
Who Can Benefit from This Product?
- Investors: Evaluate the valuation of Guangdong Provincial Expressway Development Co., Ltd. (200429SZ) before deciding to buy or sell shares.
- CFOs and Financial Analysts: Enhance valuation workflows and assess financial projections.
- Startup Founders: Discover valuation methodologies used by leading public companies like Guangdong Provincial Expressway Development Co., Ltd. (200429SZ).
- Consultants: Provide clients with comprehensive valuation reports and insights.
- Students and Educators: Utilize real-world case studies to practice and teach valuation methodologies.
What the Template Includes
- Pre-Filled DCF Model: Guangdong Provincial Expressway Development Co., Ltd.'s (200429SZ) financial data ready for immediate analysis.
- WACC Calculator: Comprehensive calculations for the Weighted Average Cost of Capital.
- Financial Ratios: Assess Guangdong Provincial Expressway Development Co., Ltd.'s (200429SZ) profitability, leverage, and operational efficiency.
- Editable Inputs: Adjust assumptions like growth rates, profit margins, and capital expenditures to suit your financial scenarios.
- Financial Statements: Access annual and quarterly reports for thorough analysis and insights.
- Interactive Dashboard: Easily visualize essential valuation metrics and outcomes.
Disclaimer
All information, articles, and product details provided on this website are for general informational and educational purposes only. We do not claim any ownership over, nor do we intend to infringe upon, any trademarks, copyrights, logos, brand names, or other intellectual property mentioned or depicted on this site. Such intellectual property remains the property of its respective owners, and any references here are made solely for identification or informational purposes, without implying any affiliation, endorsement, or partnership.
We make no representations or warranties, express or implied, regarding the accuracy, completeness, or suitability of any content or products presented. Nothing on this website should be construed as legal, tax, investment, financial, medical, or other professional advice. In addition, no part of this site—including articles or product references—constitutes a solicitation, recommendation, endorsement, advertisement, or offer to buy or sell any securities, franchises, or other financial instruments, particularly in jurisdictions where such activity would be unlawful.
All content is of a general nature and may not address the specific circumstances of any individual or entity. It is not a substitute for professional advice or services. Any actions you take based on the information provided here are strictly at your own risk. You accept full responsibility for any decisions or outcomes arising from your use of this website and agree to release us from any liability in connection with your use of, or reliance upon, the content or products found herein.