
|
SSY Group Limited (2005.HK) DCF -Bewertung |
Fully Editable: Tailor To Your Needs In Excel Or Sheets
Professional Design: Trusted, Industry-Standard Templates
Investor-Approved Valuation Models
MAC/PC Compatible, Fully Unlocked
No Expertise Is Needed; Easy To Follow
SSY Group Limited (2005.HK) Bundle
Vereinfachen Sie die Bewertung der SSY Group Limited (2005HK) mit diesem anpassbaren DCF -Taschenrechner! Mit Real Ssy Group Limited (2005HK) Finanzdaten und einstellbaren Prognoseeingaben können Sie Szenarien testen und SSY Group Limited (2005HK) in Minuten aufdecken.
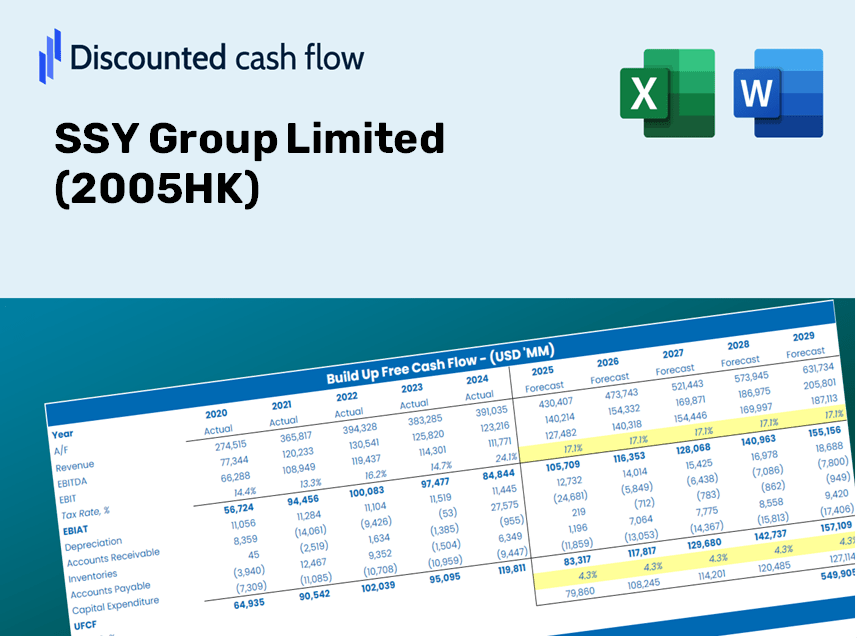
Discounted Cash Flow (DCF) - (USD MM)
| Year | AY1 2020 |
AY2 2021 |
AY3 2022 |
AY4 2023 |
AY5 2024 |
FY1 2025 |
FY2 2026 |
FY3 2027 |
FY4 2028 |
FY5 2029 |
|---|---|---|---|---|---|---|---|---|---|---|
| Revenue | 4,260.9 | 5,356.8 | 6,434.0 | 6,463.0 | 5,773.3 | 6,287.2 | 6,846.9 | 7,456.4 | 8,120.1 | 8,843.0 |
| Revenue Growth, % | 0 | 25.72 | 20.11 | 0.45048 | -10.67 | 8.9 | 8.9 | 8.9 | 8.9 | 8.9 |
| EBITDA | 1,094.0 | 1,399.5 | 1,858.5 | 2,114.6 | 1,738.7 | 1,804.7 | 1,965.3 | 2,140.3 | 2,330.8 | 2,538.3 |
| EBITDA, % | 25.68 | 26.13 | 28.88 | 32.72 | 30.12 | 28.7 | 28.7 | 28.7 | 28.7 | 28.7 |
| Depreciation | 317.4 | 389.8 | 371.1 | 405.6 | 394.9 | 422.6 | 460.2 | 501.2 | 545.8 | 594.4 |
| Depreciation, % | 7.45 | 7.28 | 5.77 | 6.28 | 6.84 | 6.72 | 6.72 | 6.72 | 6.72 | 6.72 |
| EBIT | 776.7 | 1,009.7 | 1,487.4 | 1,709.0 | 1,343.8 | 1,382.1 | 1,505.1 | 1,639.1 | 1,785.0 | 1,943.9 |
| EBIT, % | 18.23 | 18.85 | 23.12 | 26.44 | 23.28 | 21.98 | 21.98 | 21.98 | 21.98 | 21.98 |
| Total Cash | 1,512.3 | 1,699.7 | 1,714.3 | 1,615.2 | 1,292.7 | 1,776.1 | 1,934.2 | 2,106.4 | 2,293.9 | 2,498.1 |
| Total Cash, percent | .0 | .0 | .0 | .0 | .0 | .0 | .0 | .0 | .0 | .0 |
| Account Receivables | 1,813.3 | 2,256.0 | 2,276.4 | 2,340.0 | 2,270.7 | 2,459.4 | 2,678.3 | 2,916.8 | 3,176.4 | 3,459.2 |
| Account Receivables, % | 42.56 | 42.12 | 35.38 | 36.21 | 39.33 | 39.12 | 39.12 | 39.12 | 39.12 | 39.12 |
| Inventories | 638.3 | 827.5 | 810.7 | 1,086.3 | 1,109.5 | 994.0 | 1,082.5 | 1,178.9 | 1,283.8 | 1,398.1 |
| Inventories, % | 14.98 | 15.45 | 12.6 | 16.81 | 19.22 | 15.81 | 15.81 | 15.81 | 15.81 | 15.81 |
| Accounts Payable | 240.6 | 401.7 | 361.1 | 407.9 | 547.6 | 434.5 | 473.2 | 515.3 | 561.2 | 611.1 |
| Accounts Payable, % | 5.65 | 7.5 | 5.61 | 6.31 | 9.49 | 6.91 | 6.91 | 6.91 | 6.91 | 6.91 |
| Capital Expenditure | -291.0 | -388.3 | -418.1 | -703.9 | -540.4 | -513.4 | -559.1 | -608.9 | -663.1 | -722.1 |
| Capital Expenditure, % | -6.83 | -7.25 | -6.5 | -10.89 | -9.36 | -8.17 | -8.17 | -8.17 | -8.17 | -8.17 |
| Tax Rate, % | 17.2 | 17.2 | 17.2 | 17.2 | 17.2 | 17.2 | 17.2 | 17.2 | 17.2 | 17.2 |
| EBITAT | 655.4 | 836.3 | 1,193.7 | 1,423.0 | 1,112.7 | 1,143.1 | 1,244.8 | 1,355.6 | 1,476.3 | 1,607.7 |
| Depreciation | ||||||||||
| Changes in Account Receivables | ||||||||||
| Changes in Inventories | ||||||||||
| Changes in Accounts Payable | ||||||||||
| Capital Expenditure | ||||||||||
| UFCF | -1,529.3 | 367.0 | 1,102.5 | 832.3 | 1,153.0 | 865.8 | 877.2 | 955.3 | 1,040.3 | 1,132.9 |
| WACC, % | 5.32 | 5.31 | 5.28 | 5.31 | 5.3 | 5.3 | 5.3 | 5.3 | 5.3 | 5.3 |
| PV UFCF | ||||||||||
| SUM PV UFCF | 4,152.3 | |||||||||
| Long Term Growth Rate, % | 2.00 | |||||||||
| Free cash flow (T + 1) | 1,156 | |||||||||
| Terminal Value | 34,978 | |||||||||
| Present Terminal Value | 27,014 | |||||||||
| Enterprise Value | 31,166 | |||||||||
| Net Debt | 2,382 | |||||||||
| Equity Value | 28,784 | |||||||||
| Diluted Shares Outstanding, MM | 2,963 | |||||||||
| Equity Value Per Share | 9.71 |
Benefits You'll Receive
- Pre-Filled Financial Model: SSY Group Limited’s actual data allows for accurate DCF valuation.
- Comprehensive Forecast Control: Modify revenue growth, profit margins, WACC, and other crucial metrics.
- Real-Time Calculations: Instant updates provide immediate visibility of results as adjustments are made.
- Professional-Grade Template: A polished Excel file crafted for high-quality valuation purposes.
- Flexible and Reusable: Designed for adaptability, enabling continual use for in-depth forecasting.
Key Features
- Comprehensive DCF Calculator: Features in-depth unlevered and levered DCF valuation models tailored for SSY Group Limited (2005HK).
- WACC Framework: Ready-to-use Weighted Average Cost of Capital sheet with adjustable parameters.
- Customizable Forecast Inputs: Easily change growth projections, capital investment, and discount rates.
- Integrated Financial Ratios: Assess profitability, leverage, and efficiency ratios specific to SSY Group Limited (2005HK).
- Interactive Dashboard and Visuals: Graphical representations that consolidate key valuation metrics for streamlined analysis.
How It Works
- Download: Obtain the pre-built Excel file containing SSY Group Limited’s (2005HK) financial data.
- Customize: Modify forecasts such as revenue growth, EBITDA percentage, and WACC.
- Update Automatically: View real-time updates for intrinsic value and NPV calculations.
- Test Scenarios: Generate multiple projections and assess outcomes instantly.
- Make Decisions: Leverage the valuation results to inform your investment strategy.
Why Opt for This Calculator?
- Precision: Utilizes authentic SSY Group Limited (2005HK) financial data for reliable outcomes.
- Versatility: Built to allow users to explore and adjust inputs with ease.
- Efficiency: Eliminate the need to create a discounted cash flow (DCF) model from the ground up.
- High-Quality: Crafted with the expertise and functionality expected by CFOs.
- Intuitive: Simple to navigate, catering to users without extensive financial analysis skills.
Who Would Benefit from This Product?
- Investors: Assess SSY Group Limited’s (2005HK) valuation prior to making stock transactions.
- CFOs and Financial Analysts: Optimize valuation methodologies and evaluate financial forecasts.
- Startup Founders: Understand the valuation of significant public entities like SSY Group Limited (2005HK).
- Consultants: Provide expert valuation reports to serve your clients' needs.
- Students and Educators: Utilize up-to-date data for practicing and teaching valuation methods.
Contents of the Template
- Operating and Balance Sheet Data: Pre-filled historical data and forecasts for SSY Group Limited (2005HK), including revenue, EBITDA, EBIT, and capital expenditures.
- WACC Calculation: A dedicated sheet for the Weighted Average Cost of Capital (WACC), featuring key parameters such as Beta, risk-free rate, and share price.
- DCF Valuation (Unlevered and Levered): Customizable Discounted Cash Flow models displaying intrinsic value with comprehensive calculations.
- Financial Statements: Pre-loaded financial statements (annual and quarterly) to assist in thorough analysis.
- Key Ratios: Includes profitability, leverage, and efficiency ratios pertinent to SSY Group Limited (2005HK).
- Dashboard and Charts: Visual representation of valuation outputs and assumptions for easier analysis of results.
Disclaimer
All information, articles, and product details provided on this website are for general informational and educational purposes only. We do not claim any ownership over, nor do we intend to infringe upon, any trademarks, copyrights, logos, brand names, or other intellectual property mentioned or depicted on this site. Such intellectual property remains the property of its respective owners, and any references here are made solely for identification or informational purposes, without implying any affiliation, endorsement, or partnership.
We make no representations or warranties, express or implied, regarding the accuracy, completeness, or suitability of any content or products presented. Nothing on this website should be construed as legal, tax, investment, financial, medical, or other professional advice. In addition, no part of this site—including articles or product references—constitutes a solicitation, recommendation, endorsement, advertisement, or offer to buy or sell any securities, franchises, or other financial instruments, particularly in jurisdictions where such activity would be unlawful.
All content is of a general nature and may not address the specific circumstances of any individual or entity. It is not a substitute for professional advice or services. Any actions you take based on the information provided here are strictly at your own risk. You accept full responsibility for any decisions or outcomes arising from your use of this website and agree to release us from any liability in connection with your use of, or reliance upon, the content or products found herein.