
|
China Gold International Resources Corp. Ltd. (2099.HK) DCF -Bewertung |
Fully Editable: Tailor To Your Needs In Excel Or Sheets
Professional Design: Trusted, Industry-Standard Templates
Investor-Approved Valuation Models
MAC/PC Compatible, Fully Unlocked
No Expertise Is Needed; Easy To Follow
China Gold International Resources Corp. Ltd. (2099.HK) Bundle
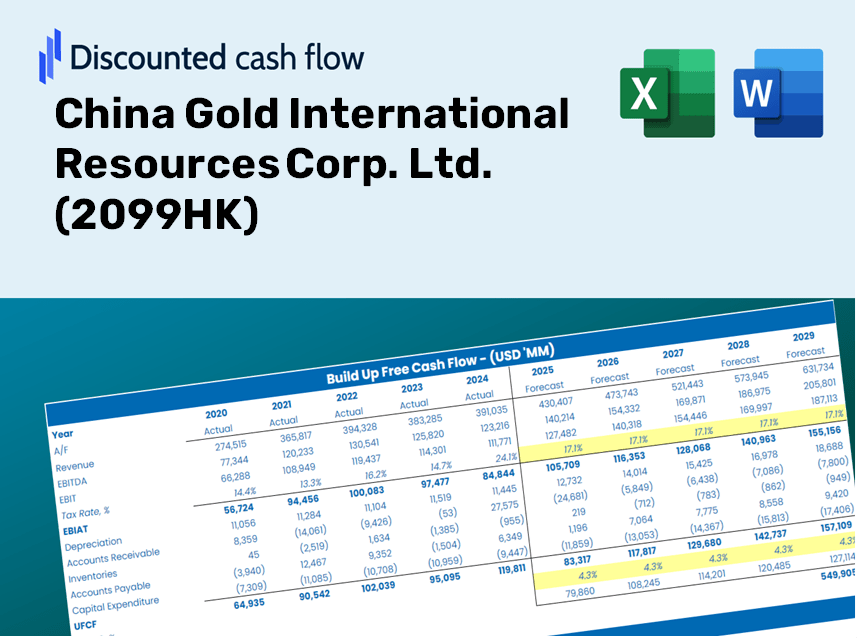
Gewinnen Sie Einblicke in Ihre China Gold International Resources Corp. Ltd. (2099HK) Bewertungsanalyse mit unserem ausgeklügelten DCF -Taschenrechner! Diese Excel -Vorlage wird mit realen (2099HK) Daten vorinstalliert, sodass Sie Prognosen und Annahmen anpassen können, um den inneren Wert von China Gold International Resources Corp. Ltd. genau zu bestimmen.
Discounted Cash Flow (DCF) - (USD MM)
| Year | AY1 2020 |
AY2 2021 |
AY3 2022 |
AY4 2023 |
AY5 2024 |
FY1 2025 |
FY2 2026 |
FY3 2027 |
FY4 2028 |
FY5 2029 |
|---|---|---|---|---|---|---|---|---|---|---|
| Revenue | 6,714.1 | 8,838.0 | 8,586.1 | 3,570.1 | 5,879.6 | 6,394.9 | 6,955.3 | 7,564.8 | 8,227.8 | 8,948.9 |
| Revenue Growth, % | 0 | 31.63 | -2.85 | -58.42 | 64.69 | 8.76 | 8.76 | 8.76 | 8.76 | 8.76 |
| EBITDA | 2,737.0 | 4,025.8 | 3,952.9 | 965.0 | 2,010.8 | 2,475.9 | 2,692.9 | 2,928.9 | 3,185.5 | 3,464.7 |
| EBITDA, % | 40.76 | 45.55 | 46.04 | 27.03 | 34.2 | 38.72 | 38.72 | 38.72 | 38.72 | 38.72 |
| Depreciation | 1,454.5 | 1,366.1 | 1,616.6 | 945.5 | 1,134.3 | 1,301.0 | 1,415.0 | 1,539.0 | 1,673.9 | 1,820.6 |
| Depreciation, % | 21.66 | 15.46 | 18.83 | 26.48 | 19.29 | 20.34 | 20.34 | 20.34 | 20.34 | 20.34 |
| EBIT | 1,282.4 | 2,659.7 | 2,336.3 | 19.6 | 876.5 | 1,174.9 | 1,277.8 | 1,389.8 | 1,511.6 | 1,644.1 |
| EBIT, % | 19.1 | 30.09 | 27.21 | 0.54807 | 14.91 | 18.37 | 18.37 | 18.37 | 18.37 | 18.37 |
| Total Cash | 1,890.5 | 1,617.3 | 3,329.3 | 755.6 | 2,346.9 | 1,871.3 | 2,035.3 | 2,213.7 | 2,407.7 | 2,618.7 |
| Total Cash, percent | .0 | .0 | .0 | .0 | .0 | .0 | .0 | .0 | .0 | .0 |
| Account Receivables | 277.9 | 201.4 | 67.7 | 150.5 | 57.4 | 158.6 | 172.5 | 187.6 | 204.0 | 221.9 |
| Account Receivables, % | 4.14 | 2.28 | 0.789 | 4.21 | 0.97708 | 2.48 | 2.48 | 2.48 | 2.48 | 2.48 |
| Inventories | 2,313.3 | 2,328.4 | 2,277.5 | 2,265.5 | 2,256.6 | 2,419.4 | 2,631.4 | 2,862.0 | 3,112.8 | 3,385.6 |
| Inventories, % | 34.45 | 26.35 | 26.53 | 63.46 | 38.38 | 37.83 | 37.83 | 37.83 | 37.83 | 37.83 |
| Accounts Payable | 848.0 | 710.3 | 546.5 | 146.6 | 1,360.9 | 694.3 | 755.1 | 821.3 | 893.3 | 971.6 |
| Accounts Payable, % | 12.63 | 8.04 | 6.37 | 4.11 | 23.15 | 10.86 | 10.86 | 10.86 | 10.86 | 10.86 |
| Capital Expenditure | -1,176.4 | -1,197.3 | -354.2 | -477.7 | -657.7 | -764.3 | -831.3 | -904.1 | -983.4 | -1,069.5 |
| Capital Expenditure, % | -17.52 | -13.55 | -4.12 | -13.38 | -11.19 | -11.95 | -11.95 | -11.95 | -11.95 | -11.95 |
| Tax Rate, % | 32.71 | 32.71 | 32.71 | 32.71 | 32.71 | 32.71 | 32.71 | 32.71 | 32.71 | 32.71 |
| EBITAT | 1,144.7 | 2,281.7 | 1,890.5 | 26.7 | 589.8 | 994.6 | 1,081.7 | 1,176.5 | 1,279.6 | 1,391.8 |
| Depreciation | ||||||||||
| Changes in Account Receivables | ||||||||||
| Changes in Inventories | ||||||||||
| Changes in Accounts Payable | ||||||||||
| Capital Expenditure | ||||||||||
| UFCF | -320.3 | 2,374.2 | 3,173.7 | 23.8 | 2,382.6 | 600.8 | 1,500.4 | 1,631.9 | 1,774.9 | 1,930.5 |
| WACC, % | 10.27 | 10.26 | 10.24 | 10.31 | 10.19 | 10.25 | 10.25 | 10.25 | 10.25 | 10.25 |
| PV UFCF | ||||||||||
| SUM PV UFCF | 5,382.9 | |||||||||
| Long Term Growth Rate, % | 2.00 | |||||||||
| Free cash flow (T + 1) | 1,969 | |||||||||
| Terminal Value | 23,856 | |||||||||
| Present Terminal Value | 14,643 | |||||||||
| Enterprise Value | 20,025 | |||||||||
| Net Debt | 4,346 | |||||||||
| Equity Value | 15,679 | |||||||||
| Diluted Shares Outstanding, MM | 396 | |||||||||
| Equity Value Per Share | 39.55 |
What You Will Receive
- Pre-Filled Financial Model: Actual data from China Gold International Resources Corp. Ltd. (2099HK) enables accurate DCF valuation.
- Comprehensive Forecast Control: Modify revenue growth, profit margins, WACC, and other essential drivers.
- Real-Time Calculations: Automatic updates allow you to view results instantly as you make adjustments.
- Investor-Ready Template: A polished Excel file crafted for professional standard valuation.
- Customizable and Reusable: Designed for adaptability, allowing for frequent use in detailed forecasting.
Key Features
- Pre-Loaded Data: Historical financial statements and pre-filled forecasts for China Gold International Resources Corp. Ltd. (2099HK).
- Fully Adjustable Inputs: Customize WACC, tax rates, revenue growth, and EBITDA margins to fit your analysis.
- Instant Results: View real-time recalculations of China Gold International’s intrinsic value.
- Clear Visual Outputs: Engaging dashboard charts that illustrate valuation results and essential metrics.
- Built for Accuracy: A precision tool designed for analysts, investors, and finance professionals.
How It Operates
- Download: Obtain the pre-prepared Excel file containing financial data for China Gold International Resources Corp. Ltd. (2099HK).
- Customize: Modify projections, such as revenue growth, EBITDA %, and WACC.
- Update Automatically: The calculations for intrinsic value and NPV refresh in real-time.
- Test Scenarios: Create various forecasts and quickly compare the results.
- Make Decisions: Leverage the valuation insights to inform your investment approach.
Why Choose This Calculator for China Gold International Resources Corp. Ltd. (2099HK)?
- User-Friendly Interface: Tailored for both novices and seasoned professionals.
- Customizable Inputs: Adjust assumptions easily to suit your analytical needs.
- Real-Time Updates: Observe immediate changes to the valuation of China Gold International as you modify settings.
- Pre-Configured Data: Comes preloaded with the latest financial information for efficient analysis.
- Preferred by Experts: A choice tool for investors and analysts seeking to make well-informed choices.
Who Should Use This Product?
- Individual Investors: Make informed decisions about buying or selling shares of China Gold International Resources Corp. Ltd. (2099HK).
- Financial Analysts: Enhance valuation processes with pre-built financial models tailored for the mining sector.
- Consultants: Provide clients with expert valuation insights on gold and mining investments swiftly and accurately.
- Business Owners: Gain insights into how major mining companies like China Gold International are valued to inform your own business strategy.
- Finance Students: Explore valuation methodologies employing real-world data from the mining industry.
Contents of the Template
- Pre-Filled DCF Model: Financial data for China Gold International Resources Corp. Ltd. (2099HK) already integrated for quick access.
- WACC Calculator: Comprehensive calculations for Weighted Average Cost of Capital.
- Financial Ratios: Assess China Gold International’s profitability, leverage, and operational efficiency.
- Editable Inputs: Modify assumptions like growth rates, margins, and CAPEX to align with your models.
- Financial Statements: Access annual and quarterly reports for in-depth analysis.
- Interactive Dashboard: Conveniently visualize essential valuation metrics and outcomes.
Disclaimer
All information, articles, and product details provided on this website are for general informational and educational purposes only. We do not claim any ownership over, nor do we intend to infringe upon, any trademarks, copyrights, logos, brand names, or other intellectual property mentioned or depicted on this site. Such intellectual property remains the property of its respective owners, and any references here are made solely for identification or informational purposes, without implying any affiliation, endorsement, or partnership.
We make no representations or warranties, express or implied, regarding the accuracy, completeness, or suitability of any content or products presented. Nothing on this website should be construed as legal, tax, investment, financial, medical, or other professional advice. In addition, no part of this site—including articles or product references—constitutes a solicitation, recommendation, endorsement, advertisement, or offer to buy or sell any securities, franchises, or other financial instruments, particularly in jurisdictions where such activity would be unlawful.
All content is of a general nature and may not address the specific circumstances of any individual or entity. It is not a substitute for professional advice or services. Any actions you take based on the information provided here are strictly at your own risk. You accept full responsibility for any decisions or outcomes arising from your use of this website and agree to release us from any liability in connection with your use of, or reliance upon, the content or products found herein.