
|
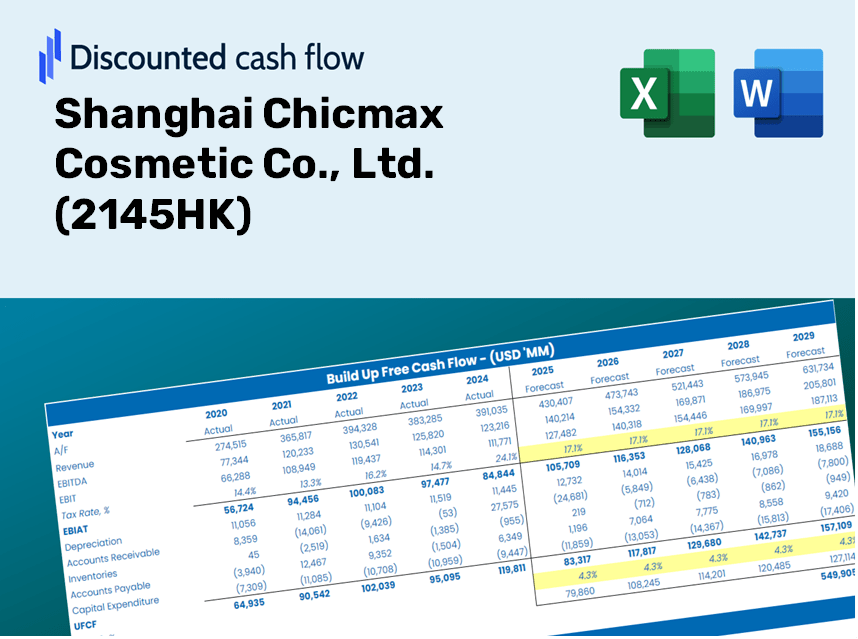
Shanghai Chicmax Cosmetic Co., Ltd. (2145.HK) DCF -Bewertung |
Fully Editable: Tailor To Your Needs In Excel Or Sheets
Professional Design: Trusted, Industry-Standard Templates
Investor-Approved Valuation Models
MAC/PC Compatible, Fully Unlocked
No Expertise Is Needed; Easy To Follow
Shanghai Chicmax Cosmetic Co., Ltd. (2145.HK) Bundle
Unser (2145HK) DCF-Taschenrechner entwickelt für die Genauigkeit und ermöglicht es Ihnen, die Bewertung von Shanghai Chicmax Cosmetic Co., Ltd., unter Verwendung realer Finanzdaten und der Flexibilität zur Änderung aller wesentlichen Parameter für verbesserte Projektionen zu bewerten.
Discounted Cash Flow (DCF) - (USD MM)
| Year | AY1 2020 |
AY2 2021 |
AY3 2022 |
AY4 2023 |
AY5 2024 |
FY1 2025 |
FY2 2026 |
FY3 2027 |
FY4 2028 |
FY5 2029 |
|---|---|---|---|---|---|---|---|---|---|---|
| Revenue | 3,694.6 | 3,953.8 | 2,922.9 | 4,578.5 | 7,421.1 | 9,270.2 | 11,580.2 | 14,465.7 | 18,070.2 | 22,572.8 |
| Revenue Growth, % | 0 | 7.02 | -26.07 | 56.64 | 62.08 | 24.92 | 24.92 | 24.92 | 24.92 | 24.92 |
| EBITDA | 441.3 | 442.1 | 293.8 | 738.6 | 821.7 | 1,119.5 | 1,398.5 | 1,746.9 | 2,182.2 | 2,726.0 |
| EBITDA, % | 11.95 | 11.18 | 10.05 | 16.13 | 11.07 | 12.08 | 12.08 | 12.08 | 12.08 | 12.08 |
| Depreciation | 91.6 | 67.5 | 102.9 | 109.9 | 74.9 | 206.1 | 257.4 | 321.6 | 401.7 | 501.8 |
| Depreciation, % | 2.48 | 1.71 | 3.52 | 2.4 | 1.01 | 2.22 | 2.22 | 2.22 | 2.22 | 2.22 |
| EBIT | 349.7 | 374.7 | 190.9 | 628.7 | 746.7 | 913.4 | 1,141.0 | 1,425.4 | 1,780.5 | 2,224.2 |
| EBIT, % | 9.47 | 9.48 | 6.53 | 13.73 | 10.06 | 9.85 | 9.85 | 9.85 | 9.85 | 9.85 |
| Total Cash | 190.4 | 171.8 | 1,280.0 | 999.1 | 800.5 | 1,592.6 | 1,989.5 | 2,485.2 | 3,104.4 | 3,878.0 |
| Total Cash, percent | .0 | .0 | .0 | .0 | .0 | .0 | .0 | .0 | .0 | .0 |
| Account Receivables | 372.4 | 409.6 | 408.6 | 713.5 | 621.4 | 1,082.3 | 1,352.0 | 1,688.8 | 2,109.7 | 2,635.3 |
| Account Receivables, % | 10.08 | 10.36 | 13.98 | 15.58 | 8.37 | 11.67 | 11.67 | 11.67 | 11.67 | 11.67 |
| Inventories | 630.7 | 678.7 | 566.1 | 558.0 | 754.5 | 1,408.3 | 1,759.2 | 2,197.6 | 2,745.2 | 3,429.2 |
| Inventories, % | 17.07 | 17.17 | 19.37 | 12.19 | 10.17 | 15.19 | 15.19 | 15.19 | 15.19 | 15.19 |
| Accounts Payable | 599.9 | 618.3 | 463.4 | 566.6 | 697.5 | 1,288.7 | 1,609.8 | 2,010.9 | 2,512.0 | 3,137.9 |
| Accounts Payable, % | 16.24 | 15.64 | 15.85 | 12.38 | 9.4 | 13.9 | 13.9 | 13.9 | 13.9 | 13.9 |
| Capital Expenditure | -154.5 | -71.8 | -65.6 | -96.7 | -265.0 | -258.2 | -322.5 | -402.9 | -503.3 | -628.7 |
| Capital Expenditure, % | -4.18 | -1.82 | -2.25 | -2.11 | -3.57 | -2.79 | -2.79 | -2.79 | -2.79 | -2.79 |
| Tax Rate, % | 15.72 | 15.72 | 15.72 | 15.72 | 15.72 | 15.72 | 15.72 | 15.72 | 15.72 | 15.72 |
| EBITAT | 254.5 | 311.1 | 182.1 | 518.4 | 629.3 | 763.5 | 953.7 | 1,191.3 | 1,488.2 | 1,859.0 |
| Depreciation | ||||||||||
| Changes in Account Receivables | ||||||||||
| Changes in Inventories | ||||||||||
| Changes in Accounts Payable | ||||||||||
| Capital Expenditure | ||||||||||
| UFCF | -211.6 | 240.0 | 178.0 | 338.0 | 465.7 | 187.9 | 589.1 | 735.9 | 919.3 | 1,148.3 |
| WACC, % | 5.95 | 5.95 | 5.95 | 5.95 | 5.95 | 5.95 | 5.95 | 5.95 | 5.95 | 5.95 |
| PV UFCF | ||||||||||
| SUM PV UFCF | 2,910.7 | |||||||||
| Long Term Growth Rate, % | 2.00 | |||||||||
| Free cash flow (T + 1) | 1,171 | |||||||||
| Terminal Value | 29,665 | |||||||||
| Present Terminal Value | 22,221 | |||||||||
| Enterprise Value | 25,132 | |||||||||
| Net Debt | -380 | |||||||||
| Equity Value | 25,512 | |||||||||
| Diluted Shares Outstanding, MM | 398 | |||||||||
| Equity Value Per Share | 64.10 |
What You Will Receive
- Pre-Filled Financial Model: Utilize Shanghai Chicmax’s actual financial data for accurate DCF valuations.
- Comprehensive Forecast Control: Modify revenue growth, profit margins, WACC, and other essential metrics.
- Real-Time Calculations: Instantaneous updates allow you to view results immediately as adjustments are made.
- Professional-Grade Template: A polished Excel file designed for high-quality valuation analyses.
- Customizable and Reusable: Engineered for adaptability, enabling repeated application for in-depth forecasting.
Key Features
- Comprehensive Data: Access to Shanghai Chicmax's historical financial records and pre-filled projections.
- Customizable Parameters: Adjust inputs like WACC, tax rates, revenue growth, and EBITDA margins.
- Real-Time Insights: Watch the intrinsic value of Shanghai Chicmax recalibrate instantly.
- Intuitive Visualizations: Engaging dashboard charts present valuation outcomes and essential metrics.
- Engineered for Precision: A robust tool designed for analysts, investors, and finance professionals.
How It Works
- Step 1: Download the Excel file.
- Step 2: Review the pre-filled data for Shanghai Chicmax Cosmetic Co., Ltd. (2145HK) including historical performance and future projections.
- Step 3: Modify key assumptions (highlighted in yellow) according to your analysis.
- Step 4: Observe the automatic recalculations reflecting the intrinsic value of Shanghai Chicmax Cosmetic Co., Ltd. (2145HK).
- Step 5: Utilize the results for making informed investment choices or for reporting purposes.
Why Select This Calculator for Shanghai Chicmax Cosmetic Co., Ltd. (2145HK)?
- User-Friendly Interface: Tailored for both novices and seasoned professionals.
- Customizable Inputs: Easily adjust parameters to suit your financial analysis.
- Real-Time Feedback: Instantly observe how changes impact Shanghai Chicmax's valuation.
- Preconfigured Data: Comes with Shanghai Chicmax's current financial information for swift evaluations.
- Endorsed by Industry Experts: Utilized by investors and analysts to guide smart investment choices.
Who Can Benefit from Our Products?
- Beauty Industry Students: Master cosmetic formulation techniques and apply them to real-world scenarios.
- Researchers: Integrate cutting-edge cosmetic models into your academic projects or studies.
- Investors: Evaluate your investment strategies by analyzing valuation metrics for Shanghai Chicmax Cosmetic Co., Ltd. (2145HK).
- Market Analysts: Enhance your analysis process with our ready-to-use, customizable market assessment tools.
- Entrepreneurs: Gain valuable insights into the competitive landscape and evaluation of major cosmetic companies like Shanghai Chicmax Cosmetic Co., Ltd. (2145HK).
Contents of the Template
- Pre-Filled Data: Contains historical financials and projections for Shanghai Chicmax Cosmetic Co., Ltd. (2145HK).
- Discounted Cash Flow Model: An editable DCF valuation model that includes automatic calculations.
- Weighted Average Cost of Capital (WACC): A dedicated worksheet for calculating WACC using customized inputs.
- Key Financial Ratios: Evaluate the profitability, efficiency, and leverage of Shanghai Chicmax Cosmetic Co., Ltd. (2145HK).
- Customizable Inputs: Easily modify revenue growth, profit margins, and tax rates.
- Clear Dashboard: Visual representations and tables summarizing essential valuation findings.
Disclaimer
All information, articles, and product details provided on this website are for general informational and educational purposes only. We do not claim any ownership over, nor do we intend to infringe upon, any trademarks, copyrights, logos, brand names, or other intellectual property mentioned or depicted on this site. Such intellectual property remains the property of its respective owners, and any references here are made solely for identification or informational purposes, without implying any affiliation, endorsement, or partnership.
We make no representations or warranties, express or implied, regarding the accuracy, completeness, or suitability of any content or products presented. Nothing on this website should be construed as legal, tax, investment, financial, medical, or other professional advice. In addition, no part of this site—including articles or product references—constitutes a solicitation, recommendation, endorsement, advertisement, or offer to buy or sell any securities, franchises, or other financial instruments, particularly in jurisdictions where such activity would be unlawful.
All content is of a general nature and may not address the specific circumstances of any individual or entity. It is not a substitute for professional advice or services. Any actions you take based on the information provided here are strictly at your own risk. You accept full responsibility for any decisions or outcomes arising from your use of this website and agree to release us from any liability in connection with your use of, or reliance upon, the content or products found herein.