
|
Shanghai Fosun Pharmaceutical Co., Ltd. (2196.HK) DCF -Bewertung |
Fully Editable: Tailor To Your Needs In Excel Or Sheets
Professional Design: Trusted, Industry-Standard Templates
Investor-Approved Valuation Models
MAC/PC Compatible, Fully Unlocked
No Expertise Is Needed; Easy To Follow
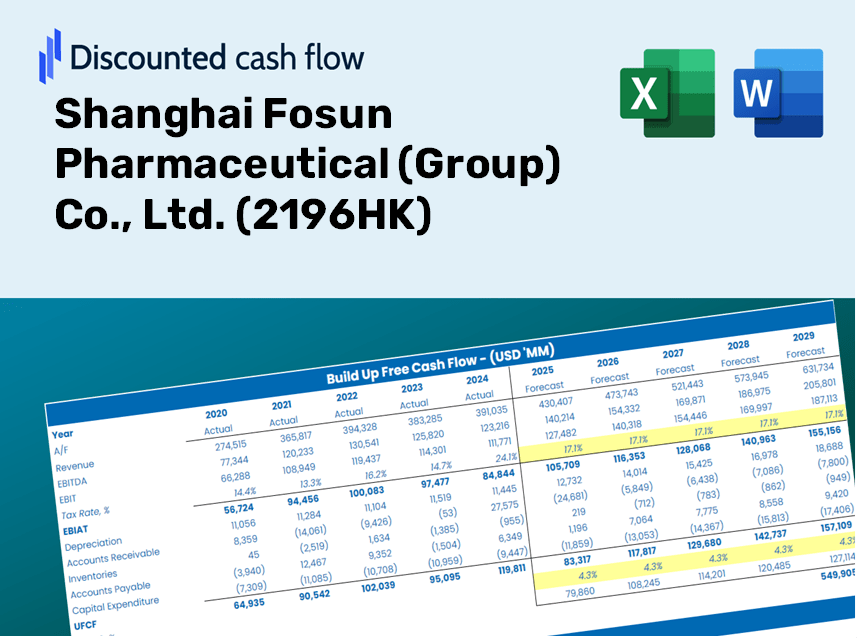
Shanghai Fosun Pharmaceutical (Group) Co., Ltd. (2196.HK) Bundle
Entdecken Sie das wahre Potenzial von Shanghai Fosun Pharmaceutical (Group) Co., Ltd. (2196HK) mit unserem fortschrittlichen DCF -Taschenrechner! Passen Sie die wichtigsten Annahmen an, erkunden Sie verschiedene Szenarien und beurteilen Sie, wie unterschiedliche Änderungen die Bewertung von Shanghai Fosun Pharmaceutical (Group) Co., Ltd. (2196HK) - alles innerhalb einer umfassenden Excel -Vorlage beeinflussen.
Discounted Cash Flow (DCF) - (USD MM)
| Year | AY1 2020 |
AY2 2021 |
AY3 2022 |
AY4 2023 |
AY5 2024 |
FY1 2025 |
FY2 2026 |
FY3 2027 |
FY4 2028 |
FY5 2029 |
|---|---|---|---|---|---|---|---|---|---|---|
| Revenue | 33,213.1 | 42,745.3 | 48,166.1 | 45,369.4 | 45,005.1 | 48,917.5 | 53,169.9 | 57,792.1 | 62,816.0 | 68,276.6 |
| Revenue Growth, % | 0 | 28.7 | 12.68 | -5.81 | -0.80277 | 8.69 | 8.69 | 8.69 | 8.69 | 8.69 |
| EBITDA | 7,917.8 | 9,533.8 | 8,629.2 | 8,279.0 | 9,427.7 | 10,101.9 | 10,980.1 | 11,934.6 | 12,972.1 | 14,099.7 |
| EBITDA, % | 23.84 | 22.3 | 17.92 | 18.25 | 20.95 | 20.65 | 20.65 | 20.65 | 20.65 | 20.65 |
| Depreciation | 1,826.0 | 2,010.3 | 2,559.9 | 3,249.5 | 3,289.4 | 2,933.8 | 3,188.8 | 3,466.0 | 3,767.3 | 4,094.8 |
| Depreciation, % | 5.5 | 4.7 | 5.31 | 7.16 | 7.31 | 6 | 6 | 6 | 6 | 6 |
| EBIT | 6,091.8 | 7,523.5 | 6,069.2 | 5,029.5 | 6,138.3 | 7,168.2 | 7,791.3 | 8,468.6 | 9,204.8 | 10,005.0 |
| EBIT, % | 18.34 | 17.6 | 12.6 | 11.09 | 13.64 | 14.65 | 14.65 | 14.65 | 14.65 | 14.65 |
| Total Cash | 13,076.1 | 15,944.4 | 18,816.3 | 17,076.3 | 17,665.7 | 18,845.7 | 20,484.0 | 22,264.6 | 24,200.1 | 26,303.9 |
| Total Cash, percent | .0 | .0 | .0 | .0 | .0 | .0 | .0 | .0 | .0 | .0 |
| Account Receivables | 6,314.1 | 8,018.4 | 9,611.7 | 9,267.6 | 10,334.3 | 9,892.5 | 10,752.5 | 11,687.2 | 12,703.1 | 13,807.4 |
| Account Receivables, % | 19.01 | 18.76 | 19.96 | 20.43 | 22.96 | 20.22 | 20.22 | 20.22 | 20.22 | 20.22 |
| Inventories | 5,657.9 | 5,997.1 | 7,542.4 | 8,260.6 | 7,954.7 | 8,081.8 | 8,784.3 | 9,548.0 | 10,378.0 | 11,280.2 |
| Inventories, % | 17.04 | 14.03 | 15.66 | 18.21 | 17.68 | 16.52 | 16.52 | 16.52 | 16.52 | 16.52 |
| Accounts Payable | 3,604.4 | 5,549.3 | 6,886.6 | 6,750.3 | 6,572.5 | 6,615.1 | 7,190.1 | 7,815.2 | 8,494.5 | 9,233.0 |
| Accounts Payable, % | 10.85 | 12.98 | 14.3 | 14.88 | 14.6 | 13.52 | 13.52 | 13.52 | 13.52 | 13.52 |
| Capital Expenditure | -4,862.6 | -5,449.4 | -6,453.5 | -5,848.4 | -4,833.1 | -6,302.3 | -6,850.1 | -7,445.6 | -8,092.9 | -8,796.4 |
| Capital Expenditure, % | -14.64 | -12.75 | -13.4 | -12.89 | -10.74 | -12.88 | -12.88 | -12.88 | -12.88 | -12.88 |
| Tax Rate, % | 33.56 | 33.56 | 33.56 | 33.56 | 33.56 | 33.56 | 33.56 | 33.56 | 33.56 | 33.56 |
| EBITAT | 4,770.0 | 5,876.7 | 4,950.0 | 3,676.3 | 4,078.0 | 5,412.0 | 5,882.5 | 6,393.8 | 6,949.7 | 7,553.8 |
| Depreciation | ||||||||||
| Changes in Account Receivables | ||||||||||
| Changes in Inventories | ||||||||||
| Changes in Accounts Payable | ||||||||||
| Capital Expenditure | ||||||||||
| UFCF | -6,634.1 | 2,338.9 | -745.0 | 567.0 | 1,595.7 | 2,400.7 | 1,233.6 | 1,340.9 | 1,457.5 | 1,584.2 |
| WACC, % | 5.93 | 5.92 | 5.99 | 5.83 | 5.72 | 5.88 | 5.88 | 5.88 | 5.88 | 5.88 |
| PV UFCF | ||||||||||
| SUM PV UFCF | 6,848.1 | |||||||||
| Long Term Growth Rate, % | 2.00 | |||||||||
| Free cash flow (T + 1) | 1,616 | |||||||||
| Terminal Value | 41,669 | |||||||||
| Present Terminal Value | 31,318 | |||||||||
| Enterprise Value | 38,166 | |||||||||
| Net Debt | 19,915 | |||||||||
| Equity Value | 18,250 | |||||||||
| Diluted Shares Outstanding, MM | 2,672 | |||||||||
| Equity Value Per Share | 6.83 |
What You Will Receive
- Authentic Fosun Data: Comprehensive financials – covering revenue to EBIT – derived from real and projected metrics.
- Complete Customization: Modify all essential variables (yellow cells) such as WACC, growth %, and tax rates to fit your analysis.
- Immediate Valuation Adjustments: Automatic recalculations that enable you to assess the effects of alterations on Fosun’s fair value.
- Flexible Excel Template: Designed for easy modifications, scenario analysis, and in-depth forecasting.
- Efficient and Precise: Eliminate the need to construct models from the ground up while ensuring accuracy and adaptability.
Key Features
- Real-Time 2196HK Data: Pre-loaded with Shanghai Fosun Pharmaceutical's historical financial performance and forward-looking estimates.
- Completely Customizable Inputs: Modify revenue growth, profit margins, discount rates, tax rates, and capital investments.
- Dynamic Valuation Framework: Automatically refreshes Net Present Value (NPV) and intrinsic value based on your adjustments.
- Scenario Analysis: Develop various forecasting scenarios to evaluate different valuation results.
- Intuitive Interface: Designed for ease of use, suitable for both professionals and newcomers.
How It Works
- Step 1: Download the Excel file.
- Step 2: Review Shanghai Fosun Pharmaceutical's pre-filled financial data and forecasts.
- Step 3: Adjust key inputs such as revenue growth, WACC, and tax rates (highlighted cells).
- Step 4: Observe the DCF model update in real-time as you modify your assumptions.
- Step 5: Evaluate the outputs and leverage the results for your investment strategies.
Why Opt for This Calculator?
- Precision: Utilizes accurate financial data from Shanghai Fosun Pharmaceutical (Group) Co., Ltd. (2196HK).
- Customizability: Built to allow users to easily experiment with and adjust their inputs.
- Efficiency: Bypass the complexities of constructing a DCF model from the ground up.
- Expert-Quality: Crafted with the expertise and usability standards expected by CFOs.
- Intuitive: User-friendly interface, suitable for those without extensive financial modeling backgrounds.
Who Should Utilize This Product?
- Investors: Accurately assess Shanghai Fosun Pharmaceutical’s (2196HK) fair value to inform your investment choices.
- CFOs: Utilize a robust DCF model for comprehensive financial reporting and analysis of Shanghai Fosun Pharmaceutical (2196HK).
- Consultants: Efficiently customize the template for valuation reports tailored to your clients involving Shanghai Fosun Pharmaceutical (2196HK).
- Entrepreneurs: Acquire knowledge of financial modeling techniques employed by leading pharmaceutical firms, including Shanghai Fosun Pharmaceutical (2196HK).
- Educators: Implement this resource as a teaching aid to illustrate various valuation methods, using Shanghai Fosun Pharmaceutical (2196HK) as a case study.
Contents of the Template
- Pre-Filled Data: Contains Shanghai Fosun Pharmaceutical's historical financials and projections.
- Discounted Cash Flow Model: An editable DCF valuation model featuring automatic calculations.
- Weighted Average Cost of Capital (WACC): A specialized sheet for WACC calculation based on user-defined inputs.
- Key Financial Ratios: Assess Fosun Pharmaceutical's profitability, efficiency, and leverage.
- Customizable Inputs: Easily modify revenue growth, profit margins, and tax rates.
- Clear Dashboard: Visuals and tables summarizing essential valuation outcomes.
Disclaimer
All information, articles, and product details provided on this website are for general informational and educational purposes only. We do not claim any ownership over, nor do we intend to infringe upon, any trademarks, copyrights, logos, brand names, or other intellectual property mentioned or depicted on this site. Such intellectual property remains the property of its respective owners, and any references here are made solely for identification or informational purposes, without implying any affiliation, endorsement, or partnership.
We make no representations or warranties, express or implied, regarding the accuracy, completeness, or suitability of any content or products presented. Nothing on this website should be construed as legal, tax, investment, financial, medical, or other professional advice. In addition, no part of this site—including articles or product references—constitutes a solicitation, recommendation, endorsement, advertisement, or offer to buy or sell any securities, franchises, or other financial instruments, particularly in jurisdictions where such activity would be unlawful.
All content is of a general nature and may not address the specific circumstances of any individual or entity. It is not a substitute for professional advice or services. Any actions you take based on the information provided here are strictly at your own risk. You accept full responsibility for any decisions or outcomes arising from your use of this website and agree to release us from any liability in connection with your use of, or reliance upon, the content or products found herein.