
|
Lygendressourcen & Technology Co., Ltd. (2245.HK) DCF -Bewertung |
Fully Editable: Tailor To Your Needs In Excel Or Sheets
Professional Design: Trusted, Industry-Standard Templates
Investor-Approved Valuation Models
MAC/PC Compatible, Fully Unlocked
No Expertise Is Needed; Easy To Follow
Lygend Resources & Technology Co., Ltd. (2245.HK) Bundle
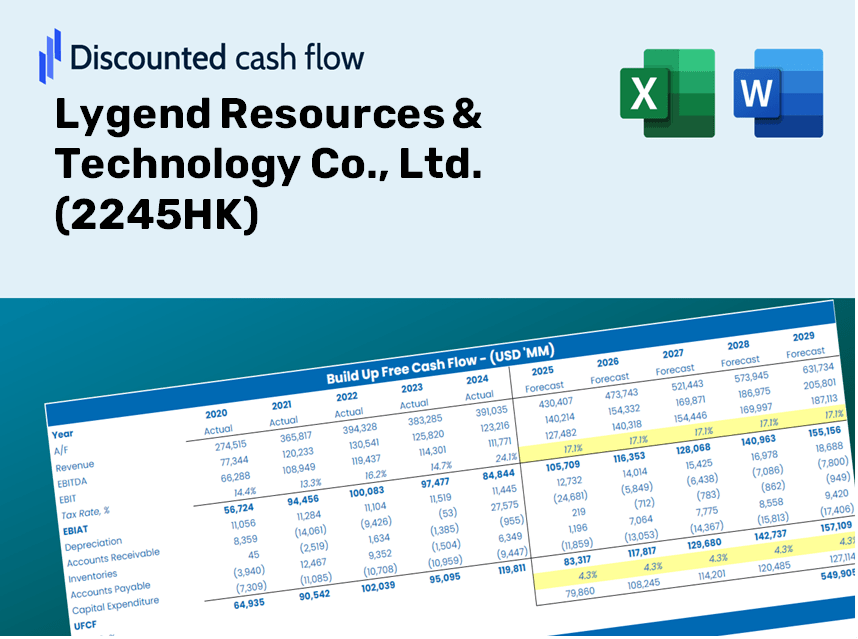
Als Anleger oder Analyst ist der (2245HK) DCF-Taschenrechner Ihre Anlaufstelle für eine genaue Bewertung. Geladen mit echten Daten aus Lygendressourcen & Technology Co., Ltd., Sie können Prognosen anpassen und die Auswirkungen in Echtzeit beobachten.
Discounted Cash Flow (DCF) - (USD MM)
| Year | AY1 2020 |
AY2 2021 |
AY3 2022 |
AY4 2023 |
AY5 2024 |
FY1 2025 |
FY2 2026 |
FY3 2027 |
FY4 2028 |
FY5 2029 |
|---|---|---|---|---|---|---|---|---|---|---|
| Revenue | 8,479.5 | 13,612.1 | 19,997.8 | 23,026.2 | 31,963.3 | 44,860.3 | 62,961.1 | 88,365.6 | 124,020.6 | 174,062.3 |
| Revenue Growth, % | 0 | 60.53 | 46.91 | 15.14 | 38.81 | 40.35 | 40.35 | 40.35 | 40.35 | 40.35 |
| EBITDA | 870.3 | 1,756.8 | 4,277.8 | 3,237.7 | 5,256.7 | 6,735.2 | 9,452.8 | 13,266.9 | 18,620.1 | 26,133.2 |
| EBITDA, % | 10.26 | 12.91 | 21.39 | 14.06 | 16.45 | 15.01 | 15.01 | 15.01 | 15.01 | 15.01 |
| Depreciation | 58.4 | 96.5 | 517.2 | 726.8 | 1,065.1 | 939.7 | 1,318.8 | 1,850.9 | 2,597.8 | 3,645.9 |
| Depreciation, % | 0.68868 | 0.70912 | 2.59 | 3.16 | 3.33 | 2.09 | 2.09 | 2.09 | 2.09 | 2.09 |
| EBIT | 811.9 | 1,660.3 | 3,760.6 | 2,510.8 | 4,191.5 | 5,795.5 | 8,134.0 | 11,416.0 | 16,022.3 | 22,487.3 |
| EBIT, % | 9.58 | 12.2 | 18.81 | 10.9 | 13.11 | 12.92 | 12.92 | 12.92 | 12.92 | 12.92 |
| Total Cash | 447.5 | 1,545.3 | 4,862.2 | 5,048.0 | 5,502.4 | 7,185.0 | 10,084.1 | 14,152.9 | 19,863.5 | 27,878.4 |
| Total Cash, percent | .0 | .0 | .0 | .0 | .0 | .0 | .0 | .0 | .0 | .0 |
| Account Receivables | 600.5 | 1,121.0 | 2,713.7 | 1,118.5 | 2,566.3 | 3,747.9 | 5,260.2 | 7,382.6 | 10,361.4 | 14,542.2 |
| Account Receivables, % | 7.08 | 8.24 | 13.57 | 4.86 | 8.03 | 8.35 | 8.35 | 8.35 | 8.35 | 8.35 |
| Inventories | 433.3 | 1,065.6 | 1,258.1 | 2,393.1 | 3,683.0 | 3,691.5 | 5,181.1 | 7,271.6 | 10,205.6 | 14,323.5 |
| Inventories, % | 5.11 | 7.83 | 6.29 | 10.39 | 11.52 | 8.23 | 8.23 | 8.23 | 8.23 | 8.23 |
| Accounts Payable | 691.4 | 796.4 | 1,055.4 | 1,366.0 | 1,664.4 | 2,729.4 | 3,830.7 | 5,376.4 | 7,545.8 | 10,590.4 |
| Accounts Payable, % | 8.15 | 5.85 | 5.28 | 5.93 | 5.21 | 6.08 | 6.08 | 6.08 | 6.08 | 6.08 |
| Capital Expenditure | -83.8 | -419.3 | -4,268.1 | -7,399.3 | -6,245.5 | -6,916.1 | -9,706.7 | -13,623.3 | -19,120.3 | -26,835.2 |
| Capital Expenditure, % | -0.98778 | -3.08 | -21.34 | -32.13 | -19.54 | -15.42 | -15.42 | -15.42 | -15.42 | -15.42 |
| Tax Rate, % | 53.55 | 53.55 | 53.55 | 53.55 | 53.55 | 53.55 | 53.55 | 53.55 | 53.55 | 53.55 |
| EBITAT | 603.0 | 1,268.5 | 2,048.9 | 1,498.6 | 1,947.1 | 3,608.1 | 5,064.0 | 7,107.3 | 9,975.1 | 14,000.0 |
| Depreciation | ||||||||||
| Changes in Account Receivables | ||||||||||
| Changes in Inventories | ||||||||||
| Changes in Accounts Payable | ||||||||||
| Capital Expenditure | ||||||||||
| UFCF | 235.2 | -102.0 | -3,228.3 | -4,403.1 | -5,672.5 | -2,493.4 | -5,224.4 | -7,332.4 | -10,290.9 | -14,443.3 |
| WACC, % | 4.3 | 4.33 | 4.01 | 4.08 | 3.89 | 4.12 | 4.12 | 4.12 | 4.12 | 4.12 |
| PV UFCF | ||||||||||
| SUM PV UFCF | -34,265.6 | |||||||||
| Long Term Growth Rate, % | 0.50 | |||||||||
| Free cash flow (T + 1) | -14,516 | |||||||||
| Terminal Value | -400,654 | |||||||||
| Present Terminal Value | -327,369 | |||||||||
| Enterprise Value | -361,635 | |||||||||
| Net Debt | 9,644 | |||||||||
| Equity Value | -371,278 | |||||||||
| Diluted Shares Outstanding, MM | 1,556 | |||||||||
| Equity Value Per Share | -238.62 |
What You Will Receive
- Authentic Lygend Resources Financial Data: Pre-loaded with Lygend’s historical and forecasted figures for accurate analysis.
- Customizable Template: Effortlessly adjust key metrics such as revenue growth, WACC, and EBITDA margin.
- Instant Calculations: Watch Lygend’s intrinsic value refresh in real-time as you modify inputs.
- Expert Valuation Tool: Tailored for investors, analysts, and consultants pursuing reliable DCF outcomes.
- Intuitive Interface: Streamlined layout and straightforward guidance suitable for all skill levels.
Key Features
- 🔍 Real-Life 2245HK Financials: Pre-filled historical and projected data for Lygend Resources & Technology Co., Ltd.
- ✏️ Fully Customizable Inputs: Modify all essential parameters (yellow cells) such as WACC, growth %, and tax rates.
- 📊 Professional DCF Valuation: Integrated formulas calculate Lygend's intrinsic value using the Discounted Cash Flow method.
- ⚡ Instant Results: Visualize Lygend's valuation immediately after adjustments are made.
- Scenario Analysis: Explore and compare outcomes for different financial assumptions side-by-side.
How It Operates
- Download the Template: Gain immediate access to the Excel-based Lygend Resources & Technology DCF Calculator for (2245HK).
- Input Your Assumptions: Modify the yellow-highlighted cells to enter your projections for growth rates, WACC, margins, and more.
- Instant Calculations: The model automatically refreshes to display the intrinsic value of Lygend Resources & Technology.
- Test Scenarios: Experiment with various assumptions to assess how potential valuation might change.
- Analyze and Decide: Utilize the findings to inform your investment or financial assessments.
Why Choose the Lygend Resources & Technology Calculator?
- Precision: Utilizes accurate Lygend financial data for reliable outcomes.
- Adaptability: Crafted to allow users the freedom to adjust and test inputs as needed.
- Efficiency: Eliminate the complexities of constructing a financial model from the ground up.
- Expert-Level: Designed with the expertise and precision expected at the CFO level.
- Intuitive: Simple and accessible, catering to users without extensive financial modeling knowledge.
Who Should Use Lygend Resources & Technology Co., Ltd. (2245HK)?
- Finance Students: Explore valuation methods and apply them to real-world data.
- Academics: Integrate industry-standard models into your lectures or research projects.
- Investors: Validate your investment hypotheses and assess valuation metrics for Lygend Resources & Technology Co., Ltd. (2245HK).
- Analysts: Enhance your analysis with a customizable, ready-to-use DCF model.
- Small Business Owners: Discover how major firms like Lygend Resources & Technology Co., Ltd. (2245HK) are evaluated in the market.
Contents of the Template
- Pre-Filled Data: Contains Lygend Resources & Technology Co., Ltd.'s historical financial figures and projections.
- Discounted Cash Flow Model: An editable DCF valuation model featuring automatic calculations.
- Weighted Average Cost of Capital (WACC): A specific sheet for calculating WACC based on input variables.
- Key Financial Ratios: Evaluate Lygend's profitability, operational efficiency, and financial leverage.
- Customizable Inputs: Easily modify revenue growth rates, profit margins, and tax assumptions.
- Clear Dashboard: Visual representations and tables summarizing essential valuation outcomes.
Disclaimer
All information, articles, and product details provided on this website are for general informational and educational purposes only. We do not claim any ownership over, nor do we intend to infringe upon, any trademarks, copyrights, logos, brand names, or other intellectual property mentioned or depicted on this site. Such intellectual property remains the property of its respective owners, and any references here are made solely for identification or informational purposes, without implying any affiliation, endorsement, or partnership.
We make no representations or warranties, express or implied, regarding the accuracy, completeness, or suitability of any content or products presented. Nothing on this website should be construed as legal, tax, investment, financial, medical, or other professional advice. In addition, no part of this site—including articles or product references—constitutes a solicitation, recommendation, endorsement, advertisement, or offer to buy or sell any securities, franchises, or other financial instruments, particularly in jurisdictions where such activity would be unlawful.
All content is of a general nature and may not address the specific circumstances of any individual or entity. It is not a substitute for professional advice or services. Any actions you take based on the information provided here are strictly at your own risk. You accept full responsibility for any decisions or outcomes arising from your use of this website and agree to release us from any liability in connection with your use of, or reliance upon, the content or products found herein.