
|
Shanghai Microport Medbot Co., Ltd. (2252.HK) DCF -Bewertung |
Fully Editable: Tailor To Your Needs In Excel Or Sheets
Professional Design: Trusted, Industry-Standard Templates
Investor-Approved Valuation Models
MAC/PC Compatible, Fully Unlocked
No Expertise Is Needed; Easy To Follow
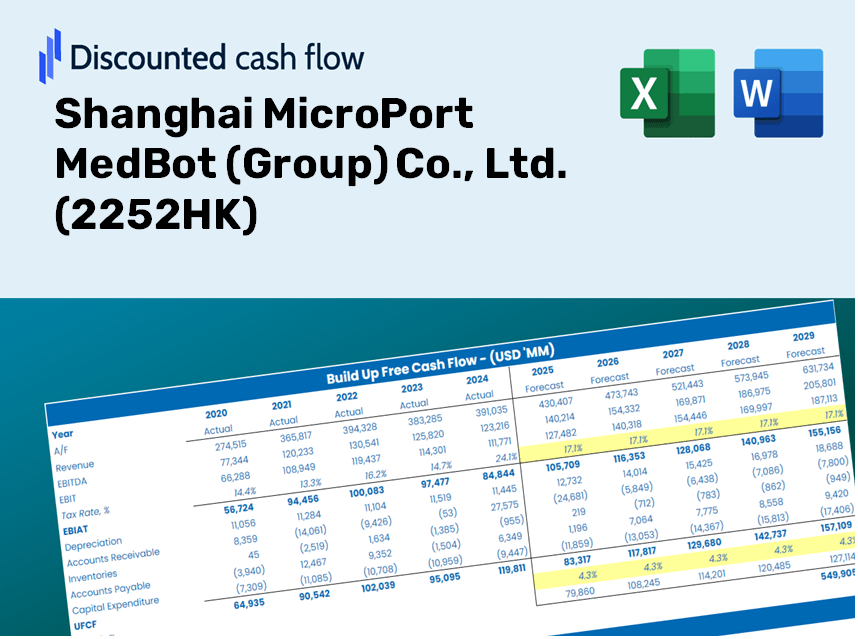
Shanghai MicroPort MedBot (Group) Co., Ltd. (2252.HK) Bundle
Unser (2252HK) DCF-Taschenrechner entwickelt für die Genauigkeit und können Sie Shanghai Microport Medbot (Group) Co., Ltd. bewerten, unter Verwendung aktueller Finanzdaten und vollständiger Flexibilität, um alle Schlüsselparameter für erweiterte Projektionen zu ändern.
Discounted Cash Flow (DCF) - (USD MM)
| Year | AY1 2020 |
AY2 2021 |
AY3 2022 |
AY4 2023 |
AY5 2024 |
FY1 2025 |
FY2 2026 |
FY3 2027 |
FY4 2028 |
FY5 2029 |
|---|---|---|---|---|---|---|---|---|---|---|
| Revenue | .0 | 2.3 | 23.6 | 114.3 | 281.1 | 491.8 | 860.7 | 1,506.3 | 2,636.0 | 4,613.0 |
| Revenue Growth, % | 0 | 0 | 904.79 | 384.15 | 145.95 | 75 | 75 | 75 | 75 | 75 |
| EBITDA | -175.8 | -594.2 | -1,152.1 | -976.0 | -451.6 | -295.1 | -516.4 | -903.8 | -1,581.6 | -2,767.8 |
| EBITDA, % | 100 | -25294.93 | -4881.21 | -854.14 | -160.68 | -60 | -60 | -60 | -60 | -60 |
| Depreciation | 1.8 | 38.6 | 46.4 | 122.1 | 66.7 | 416.8 | 729.4 | 1,276.5 | 2,233.9 | 3,909.3 |
| Depreciation, % | 100 | 1645.26 | 196.65 | 106.85 | 23.73 | 84.75 | 84.75 | 84.75 | 84.75 | 84.75 |
| EBIT | -177.6 | -632.8 | -1,198.5 | -1,098.1 | -518.3 | -295.1 | -516.4 | -903.8 | -1,581.6 | -2,767.8 |
| EBIT, % | 100 | -26940.19 | -5077.86 | -960.99 | -184.4 | -60 | -60 | -60 | -60 | -60 |
| Total Cash | 1,635.9 | 2,120.4 | 817.2 | 554.7 | 668.9 | 491.8 | 860.7 | 1,506.3 | 2,636.0 | 4,613.0 |
| Total Cash, percent | .0 | .1 | .0 | .0 | .0 | .0 | .0 | .0 | .0 | .0 |
| Account Receivables | .0 | .1 | .0 | 5.4 | 48.5 | 124.0 | 217.0 | 379.7 | 664.5 | 1,163.0 |
| Account Receivables, % | 100 | 4.05 | 0 | 4.75 | 17.26 | 25.21 | 25.21 | 25.21 | 25.21 | 25.21 |
| Inventories | .0 | 120.0 | 273.7 | 250.7 | 165.5 | 451.4 | 790.0 | 1,382.4 | 2,419.2 | 4,233.6 |
| Inventories, % | 100 | 5110.74 | 1159.46 | 219.43 | 58.88 | 91.78 | 91.78 | 91.78 | 91.78 | 91.78 |
| Accounts Payable | 31.0 | 91.3 | 136.1 | 81.1 | 89.2 | 396.2 | 693.3 | 1,213.2 | 2,123.2 | 3,715.5 |
| Accounts Payable, % | 100 | 3888.42 | 576.51 | 70.99 | 31.74 | 80.55 | 80.55 | 80.55 | 80.55 | 80.55 |
| Capital Expenditure | -16.4 | -146.4 | -212.8 | -72.6 | -46.0 | -275.3 | -481.8 | -843.2 | -1,475.6 | -2,582.3 |
| Capital Expenditure, % | 100 | -6231.58 | -901.8 | -63.54 | -16.36 | -55.98 | -55.98 | -55.98 | -55.98 | -55.98 |
| Tax Rate, % | 0.72554 | 0.72554 | 0.72554 | 0.72554 | 0.72554 | 0.72554 | 0.72554 | 0.72554 | 0.72554 | 0.72554 |
| EBITAT | -177.3 | -631.1 | -1,191.7 | -1,086.0 | -514.5 | -293.4 | -513.5 | -898.6 | -1,572.5 | -2,751.9 |
| Depreciation | ||||||||||
| Changes in Account Receivables | ||||||||||
| Changes in Inventories | ||||||||||
| Changes in Accounts Payable | ||||||||||
| Capital Expenditure | ||||||||||
| UFCF | -160.9 | -798.6 | -1,466.9 | -1,073.9 | -443.6 | -206.4 | -400.3 | -700.5 | -1,225.9 | -2,145.4 |
| WACC, % | 10.51 | 10.51 | 10.51 | 10.51 | 10.51 | 10.51 | 10.51 | 10.51 | 10.51 | 10.51 |
| PV UFCF | ||||||||||
| SUM PV UFCF | -3,157.1 | |||||||||
| Long Term Growth Rate, % | 2.00 | |||||||||
| Free cash flow (T + 1) | -2,188 | |||||||||
| Terminal Value | -25,710 | |||||||||
| Present Terminal Value | -15,598 | |||||||||
| Enterprise Value | -18,755 | |||||||||
| Net Debt | 86 | |||||||||
| Equity Value | -18,841 | |||||||||
| Diluted Shares Outstanding, MM | 967 | |||||||||
| Equity Value Per Share | -19.49 |
What You Will Receive
- Authentic MicroPort MedBot Financials: Access to historical and projected data for precise valuation.
- Customizable Inputs: Adjust parameters such as WACC, tax rates, revenue growth, and capital expenditures.
- Automated Calculations: Real-time calculations of intrinsic value and NPV.
- Scenario Analysis: Explore various scenarios to assess the future outlook of MicroPort MedBot.
- User-Friendly Design: Designed for industry professionals while remaining easy for newcomers.
Key Features
- Authentic Financial Data: Gain access to reliable pre-loaded historical figures and future forecasts for Shanghai MicroPort MedBot (Group) Co., Ltd. (2252HK).
- Customizable Projections: Modify highlighted cells, including WACC, growth rates, and profit margins to fit your analysis.
- Automated Calculations: Enjoy real-time updates for DCF, Net Present Value (NPV), and cash flow assessments.
- Interactive Dashboard: Utilize user-friendly charts and summaries that clearly present your valuation outcomes.
- Designed for All Skill Levels: An intuitive layout suited for investors, CFOs, and consultants, whether novice or experienced.
How It Functions
- 1. Access the Template: Download and open the Excel file featuring Shanghai MicroPort MedBot (Group) Co., Ltd.'s preloaded data.
- 2. Modify Assumptions: Adjust key inputs such as growth rates, WACC, and capital expenditures.
- 3. View Results Immediately: The DCF model automatically computes intrinsic value and NPV.
- 4. Explore Scenarios: Evaluate various forecasts to assess different valuation results.
- 5. Use with Assurance: Present professional valuation insights to enhance your decision-making process.
Why Select This Calculator for Shanghai MicroPort MedBot (Group) Co., Ltd. (2252HK)?
- Precise Financials: Utilize authentic financial data from Shanghai MicroPort MedBot for trustworthy valuation outcomes.
- Fully Customizable: Modify essential parameters such as growth rates, WACC, and tax rates to align with your forecasts.
- Efficiency Boost: Our pre-configured calculations save you the hassle of starting from scratch.
- Professional Tool: Tailored for investors, analysts, and consultants focusing on the medical technology sector.
- Easy to Use: With a user-friendly design and clear, step-by-step guidance, it's accessible for everyone.
Who Can Benefit from This Product?
- Investors: Evaluate Shanghai MicroPort MedBot (Group) Co., Ltd.'s [2252HK] valuation prior to making stock transactions.
- CFOs and Financial Analysts: Optimize valuation methods and validate financial forecasts.
- Startup Founders: Gain insights into how prominent medical technology companies like Shanghai MicroPort are valued.
- Consultants: Provide expert valuation assessments and reports for clients in the healthcare sector.
- Students and Educators: Utilize real-life data to practice and teach valuation strategies in finance and business courses.
Contents of the Template
- Preloaded 2252HK Data: Historical and projected financial information, including revenue, EBIT, and capital expenditures.
- DCF and WACC Models: Professional-grade spreadsheets for determining intrinsic value and Weighted Average Cost of Capital.
- Editable Inputs: Yellow-highlighted cells for modifying revenue growth, tax rates, and discount rates.
- Financial Statements: Detailed annual and quarterly financial reports for in-depth analysis.
- Key Ratios: Profitability, leverage, and efficiency ratios to assess performance.
- Dashboard and Charts: Visual representations of valuation results and underlying assumptions.
Disclaimer
All information, articles, and product details provided on this website are for general informational and educational purposes only. We do not claim any ownership over, nor do we intend to infringe upon, any trademarks, copyrights, logos, brand names, or other intellectual property mentioned or depicted on this site. Such intellectual property remains the property of its respective owners, and any references here are made solely for identification or informational purposes, without implying any affiliation, endorsement, or partnership.
We make no representations or warranties, express or implied, regarding the accuracy, completeness, or suitability of any content or products presented. Nothing on this website should be construed as legal, tax, investment, financial, medical, or other professional advice. In addition, no part of this site—including articles or product references—constitutes a solicitation, recommendation, endorsement, advertisement, or offer to buy or sell any securities, franchises, or other financial instruments, particularly in jurisdictions where such activity would be unlawful.
All content is of a general nature and may not address the specific circumstances of any individual or entity. It is not a substitute for professional advice or services. Any actions you take based on the information provided here are strictly at your own risk. You accept full responsibility for any decisions or outcomes arising from your use of this website and agree to release us from any liability in connection with your use of, or reliance upon, the content or products found herein.