
|
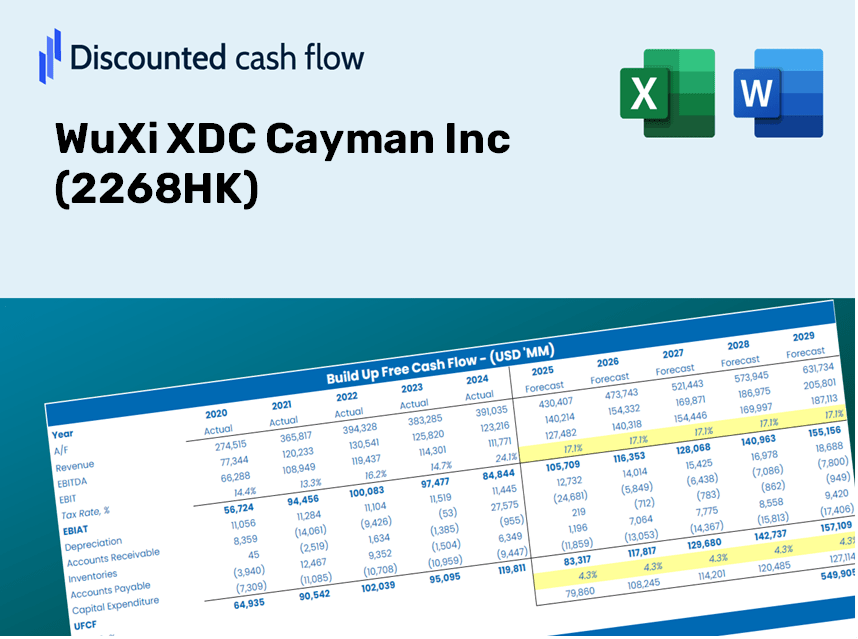
Wuxi XDC Cayman Inc (2268.HK) DCF -Bewertung |
Fully Editable: Tailor To Your Needs In Excel Or Sheets
Professional Design: Trusted, Industry-Standard Templates
Investor-Approved Valuation Models
MAC/PC Compatible, Fully Unlocked
No Expertise Is Needed; Easy To Follow
WuXi XDC Cayman Inc (2268.HK) Bundle
Bewerten Sie die finanziellen Aussichten von Wuxi XDC Cayman Inc (2268HK) wie ein Experte! Dieser (2268HK) DCF-Taschenrechner liefert vorgefüllte Finanzdaten und ermöglicht es Ihnen, das Umsatzwachstum, WACC, Margen und andere wichtige Annahmen anzupassen, um sich an Ihren Projektionen anzupassen.
Discounted Cash Flow (DCF) - (USD MM)
| Year | AY1 2020 |
AY2 2021 |
AY3 2022 |
AY4 2023 |
AY5 2024 |
FY1 2025 |
FY2 2026 |
FY3 2027 |
FY4 2028 |
FY5 2029 |
|---|---|---|---|---|---|---|---|---|---|---|
| Revenue | 105.3 | 339.9 | 1,082.1 | 2,320.4 | 4,427.3 | 8,752.8 | 17,304.4 | 34,210.8 | 67,634.9 | 133,714.4 |
| Revenue Growth, % | 0 | 222.91 | 218.33 | 114.44 | 90.8 | 97.7 | 97.7 | 97.7 | 97.7 | 97.7 |
| EBITDA | 7.8 | 84.5 | 165.8 | 459.2 | 1,456.8 | 1,754.9 | 3,469.4 | 6,859.0 | 13,560.3 | 26,808.7 |
| EBITDA, % | 7.36 | 24.87 | 15.32 | 19.79 | 32.9 | 20.05 | 20.05 | 20.05 | 20.05 | 20.05 |
| Depreciation | 14.7 | 19.8 | 28.2 | 59.9 | 120.6 | 485.2 | 959.3 | 1,896.5 | 3,749.3 | 7,412.4 |
| Depreciation, % | 13.97 | 5.83 | 2.61 | 2.58 | 2.72 | 5.54 | 5.54 | 5.54 | 5.54 | 5.54 |
| EBIT | -7.0 | 64.7 | 137.5 | 399.3 | 1,336.2 | 1,269.7 | 2,510.1 | 4,962.5 | 9,811.0 | 19,396.3 |
| EBIT, % | -6.61 | 19.04 | 12.71 | 17.21 | 30.18 | 14.51 | 14.51 | 14.51 | 14.51 | 14.51 |
| Total Cash | 31.0 | 28.8 | 803.0 | 4,422.1 | 4,341.0 | 5,430.0 | 10,735.1 | 21,223.3 | 41,958.5 | 82,952.1 |
| Total Cash, percent | .0 | .0 | .0 | .0 | .0 | .0 | .0 | .0 | .0 | .0 |
| Account Receivables | 27.2 | 109.2 | 514.1 | 955.9 | 1,841.7 | 3,296.0 | 6,516.1 | 12,882.4 | 25,468.5 | 50,351.4 |
| Account Receivables, % | 25.86 | 32.11 | 47.51 | 41.19 | 41.6 | 37.66 | 37.66 | 37.66 | 37.66 | 37.66 |
| Inventories | 8.4 | 26.0 | 68.8 | 51.1 | 129.7 | 474.4 | 937.9 | 1,854.3 | 3,665.9 | 7,247.5 |
| Inventories, % | 7.97 | 7.65 | 6.35 | 2.2 | 2.93 | 5.42 | 5.42 | 5.42 | 5.42 | 5.42 |
| Accounts Payable | 5.0 | 35.8 | 525.3 | 677.9 | 1,114.4 | 2,069.0 | 4,090.3 | 8,086.6 | 15,987.3 | 31,606.9 |
| Accounts Payable, % | 4.72 | 10.54 | 48.55 | 29.21 | 25.17 | 23.64 | 23.64 | 23.64 | 23.64 | 23.64 |
| Capital Expenditure | -57.8 | -56.7 | -220.0 | -589.3 | -1,644.5 | -2,703.5 | -5,344.9 | -10,566.8 | -20,890.6 | -41,300.9 |
| Capital Expenditure, % | -54.88 | -16.68 | -20.33 | -25.4 | -37.14 | -30.89 | -30.89 | -30.89 | -30.89 | -30.89 |
| Tax Rate, % | 12.31 | 12.31 | 12.31 | 12.31 | 12.31 | 12.31 | 12.31 | 12.31 | 12.31 | 12.31 |
| EBITAT | -5.7 | 53.2 | 109.4 | 314.8 | 1,171.7 | 1,039.8 | 2,055.8 | 4,064.2 | 8,035.0 | 15,885.2 |
| Depreciation | ||||||||||
| Changes in Account Receivables | ||||||||||
| Changes in Inventories | ||||||||||
| Changes in Accounts Payable | ||||||||||
| Capital Expenditure | ||||||||||
| UFCF | -79.4 | -52.4 | -40.6 | -486.2 | -880.0 | -2,022.9 | -3,992.1 | -7,892.5 | -15,603.5 | -30,848.1 |
| WACC, % | 10.44 | 10.44 | 10.44 | 10.44 | 10.45 | 10.44 | 10.44 | 10.44 | 10.44 | 10.44 |
| PV UFCF | ||||||||||
| SUM PV UFCF | -40,221.4 | |||||||||
| Long Term Growth Rate, % | 2.00 | |||||||||
| Free cash flow (T + 1) | -31,465 | |||||||||
| Terminal Value | -372,604 | |||||||||
| Present Terminal Value | -226,738 | |||||||||
| Enterprise Value | -266,960 | |||||||||
| Net Debt | -1,561 | |||||||||
| Equity Value | -265,399 | |||||||||
| Diluted Shares Outstanding, MM | 1,288 | |||||||||
| Equity Value Per Share | -206.02 |
What You Will Receive
- Pre-Populated Financial Model: Leverage WuXi XDC Cayman Inc's (2268HK) actual data for accurate DCF valuation.
- Complete Forecast Control: Modify revenue growth, profit margins, WACC, and other critical variables.
- Real-Time Calculations: Automatic updates provide instant feedback on your adjustments.
- Professional-Grade Template: A polished Excel file crafted for high-quality valuation.
- Flexible and Reusable: Designed to be adaptable for ongoing detailed forecasting needs.
Key Features
- 🔍 Real-Life WuXi XDC Financials: Pre-filled historical and projected data for WuXi XDC Cayman Inc (2268HK).
- ✏️ Fully Customizable Inputs: Modify key parameters (yellow cells) such as WACC, growth %, and tax rates to suit your analysis.
- 📊 Professional DCF Valuation: Integrated formulas compute WuXi XDC's intrinsic value utilizing the Discounted Cash Flow method.
- ⚡ Instant Results: See WuXi XDC’s valuation update immediately with any adjustments made.
- Scenario Analysis: Evaluate and compare the potential outcomes of different financial assumptions side-by-side.
How It Functions
- Download: Obtain the pre-prepared Excel file featuring WuXi XDC Cayman Inc’s (2268HK) financial data.
- Customize: Modify projections, including revenue growth rates, EBITDA percentages, and WACC.
- Update Automatically: The intrinsic value and NPV calculations refresh in real-time.
- Test Scenarios: Develop various projections and compare results instantly.
- Make Decisions: Leverage the valuation findings to inform your investment strategy.
Why Opt for This Calculator?
- All-in-One Solution: Combines DCF, WACC, and financial ratio analyses into a single tool.
- Flexible Inputs: Modify yellow-highlighted cells to explore different scenarios.
- In-depth Analysis: Automatically determines the intrinsic value and Net Present Value for WuXi XDC Cayman Inc (2268HK).
- Preloaded Information: Historical and projected data provides accurate foundational figures.
- Professional Grade: Perfect for financial analysts, investors, and business advisors.
Who Can Benefit from This Product?
- Finance Students: Master valuation techniques and practice them with real-world data.
- Researchers: Utilize professional models for your academic projects or studies.
- Investors: Validate your investment hypotheses and assess valuation results for WuXi XDC Cayman Inc (2268HK).
- Financial Analysts: Enhance your productivity with a ready-to-use, customizable DCF model.
- Entrepreneurs: Discover how major public firms like WuXi XDC Cayman Inc (2268HK) are evaluated.
Contents of the Template
- Operating and Balance Sheet Data: Historical data and forecasts for WuXi XDC Cayman Inc (2268HK), including metrics such as revenue, EBITDA, EBIT, and capital expenditures.
- WACC Calculation: A specialized sheet for calculating the Weighted Average Cost of Capital (WACC), featuring parameters like Beta, risk-free rate, and share price.
- DCF Valuation (Unlevered and Levered): Customizable Discounted Cash Flow models that display intrinsic value along with comprehensive calculations.
- Financial Statements: Pre-loaded financial statements (both annual and quarterly) to facilitate in-depth analysis.
- Key Ratios: A collection of profitability, leverage, and efficiency ratios specific to WuXi XDC Cayman Inc (2268HK).
- Dashboard and Charts: A visual overview of valuation outputs and underlying assumptions, designed for easy result analysis.
Disclaimer
All information, articles, and product details provided on this website are for general informational and educational purposes only. We do not claim any ownership over, nor do we intend to infringe upon, any trademarks, copyrights, logos, brand names, or other intellectual property mentioned or depicted on this site. Such intellectual property remains the property of its respective owners, and any references here are made solely for identification or informational purposes, without implying any affiliation, endorsement, or partnership.
We make no representations or warranties, express or implied, regarding the accuracy, completeness, or suitability of any content or products presented. Nothing on this website should be construed as legal, tax, investment, financial, medical, or other professional advice. In addition, no part of this site—including articles or product references—constitutes a solicitation, recommendation, endorsement, advertisement, or offer to buy or sell any securities, franchises, or other financial instruments, particularly in jurisdictions where such activity would be unlawful.
All content is of a general nature and may not address the specific circumstances of any individual or entity. It is not a substitute for professional advice or services. Any actions you take based on the information provided here are strictly at your own risk. You accept full responsibility for any decisions or outcomes arising from your use of this website and agree to release us from any liability in connection with your use of, or reliance upon, the content or products found herein.