
|
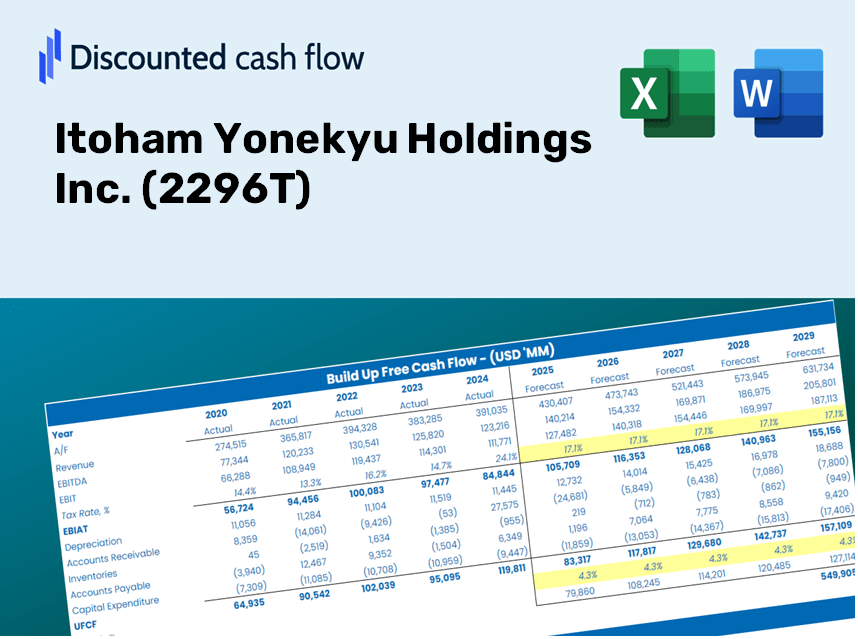
Itoham Yonekyu Holdings Inc. (2296.t) DCF -Bewertung |
Fully Editable: Tailor To Your Needs In Excel Or Sheets
Professional Design: Trusted, Industry-Standard Templates
Investor-Approved Valuation Models
MAC/PC Compatible, Fully Unlocked
No Expertise Is Needed; Easy To Follow
Itoham Yonekyu Holdings Inc. (2296.T) Bundle
Entdecken Sie die finanziellen Aussichten von Itoham Yonekyu Holdings Inc. (2296T) mit unserem benutzerfreundlichen DCF-Taschenrechner! Geben Sie Ihre Annahmen über Wachstum, Margen und Ausgaben ein, um den inneren Wert von Itoham Yonekyu Holdings Inc. (2296T) zu bestimmen und verfeinern Sie Ihre Anlagestrategie.
What You Will Receive
- Accurate 2296T Financial Data: Pre-filled with Itoham Yonekyu Holdings Inc.’s historical and projected financial information for thorough analysis.
- Fully Customizable Template: Easily adjust key inputs such as revenue growth, WACC, and EBITDA percentage.
- Instant Calculation Updates: Watch as Itoham Yonekyu Holdings Inc.’s intrinsic value recalibrates in real-time based on your modifications.
- Professional Valuation Tool: Tailored for investors, analysts, and consultants seeking reliable DCF outcomes.
- User-Friendly Interface: Intuitive layout and straightforward instructions suitable for users of all expertise levels.
Key Features
- Authentic Itoham Financials: Gain access to reliable pre-loaded historical data and future forecasts.
- Tailorable Forecast Parameters: Modify yellow-highlighted cells such as WACC, growth rates, and profit margins.
- Real-time Calculations: Automatic updates for DCF, Net Present Value (NPV), and cash flow assessments.
- Interactive Dashboard: User-friendly charts and summaries to present your valuation outcomes clearly.
- Designed for All Users: An easy-to-navigate layout perfect for investors, CFOs, and consultants alike.
How It Works
- Step 1: Download the ready-to-use Excel template featuring Itoham Yonekyu Holdings Inc. (2296T) data.
- Step 2: Review the pre-populated sheets to familiarize yourself with the essential metrics.
- Step 3: Modify the forecasts and assumptions in the editable yellow cells (WACC, growth, margins).
- Step 4: Instantly see the updated results, including the intrinsic value of Itoham Yonekyu Holdings Inc. (2296T).
- Step 5: Use the outputs to make informed investment choices or create detailed reports.
Why Choose This Calculator for Itoham Yonekyu Holdings Inc. (2296T)?
- Precise Financials: Utilize accurate data from Itoham Yonekyu Holdings to achieve trustworthy valuation outcomes.
- Flexible Customization: Tailor critical parameters such as growth rates, WACC, and tax rates to align with your forecasts.
- Efficient Workflow: Pre-configured calculations save you time by removing the need to build from the ground up.
- Professional Tool: Crafted for use by investors, analysts, and financial consultants.
- Easy to Use: The intuitive design and clear, step-by-step guidance make it accessible for all users.
Who Can Benefit from Itoham Yonekyu Holdings Inc. (2296T)?
- Investors: Make informed investment choices with our comprehensive valuation insights.
- Financial Analysts: Streamline your analysis with a customizable financial model tailored to your needs.
- Consultants: Effortlessly modify our resources for impactful client presentations and detailed reports.
- Finance Enthusiasts: Enhance your knowledge of valuation methods through practical, real-world applications.
- Educators and Students: Utilize our tools as effective educational resources in finance curricula.
Contents of the Template
- In-Depth DCF Model: Editable framework featuring comprehensive valuation calculations.
- Authentic Data: Historical and projected financials of Itoham Yonekyu Holdings Inc. (2296T) preloaded for your analysis.
- Adjustable Parameters: Customize WACC, growth rates, and tax assumptions to explore various scenarios.
- Financial Statements: Complete annual and quarterly breakdowns for enhanced insights.
- Key Ratios: Integrated analysis for profitability, operational efficiency, and financial leverage.
- Interactive Dashboard: Visual outputs including charts and tables for straightforward, actionable insights.
Disclaimer
All information, articles, and product details provided on this website are for general informational and educational purposes only. We do not claim any ownership over, nor do we intend to infringe upon, any trademarks, copyrights, logos, brand names, or other intellectual property mentioned or depicted on this site. Such intellectual property remains the property of its respective owners, and any references here are made solely for identification or informational purposes, without implying any affiliation, endorsement, or partnership.
We make no representations or warranties, express or implied, regarding the accuracy, completeness, or suitability of any content or products presented. Nothing on this website should be construed as legal, tax, investment, financial, medical, or other professional advice. In addition, no part of this site—including articles or product references—constitutes a solicitation, recommendation, endorsement, advertisement, or offer to buy or sell any securities, franchises, or other financial instruments, particularly in jurisdictions where such activity would be unlawful.
All content is of a general nature and may not address the specific circumstances of any individual or entity. It is not a substitute for professional advice or services. Any actions you take based on the information provided here are strictly at your own risk. You accept full responsibility for any decisions or outcomes arising from your use of this website and agree to release us from any liability in connection with your use of, or reliance upon, the content or products found herein.