
|
Milliarden Industrial Holdings Limited (2299.HK) DCF -Bewertung |
Fully Editable: Tailor To Your Needs In Excel Or Sheets
Professional Design: Trusted, Industry-Standard Templates
Investor-Approved Valuation Models
MAC/PC Compatible, Fully Unlocked
No Expertise Is Needed; Easy To Follow
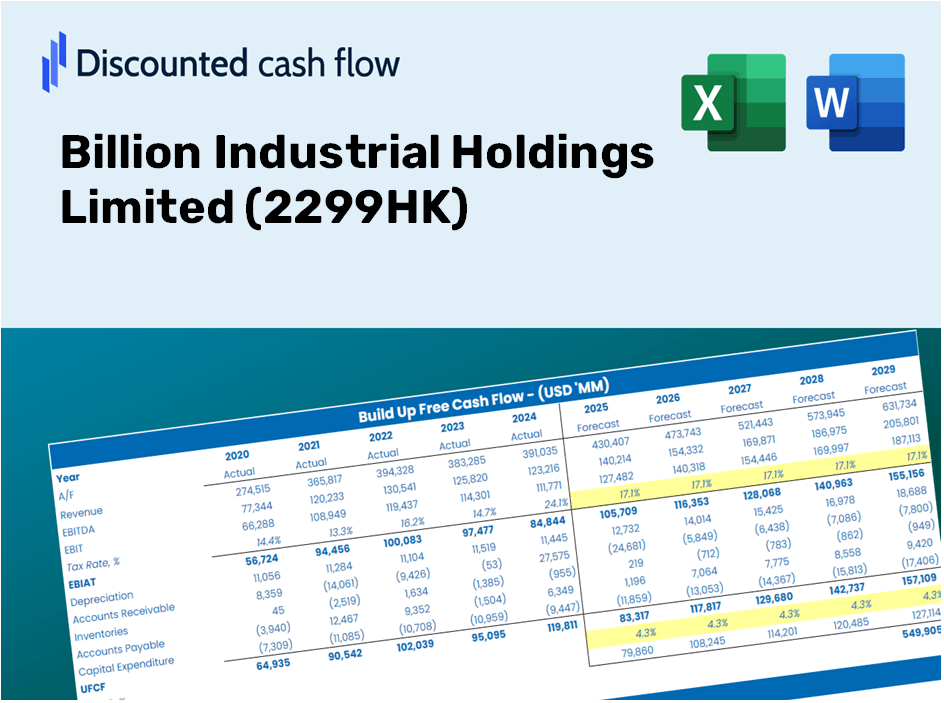
Billion Industrial Holdings Limited (2299.HK) Bundle
Vereinfachen Sie die Bewertung von Milliarden Industrial Holdings Limited mit diesem anpassbaren DCF -Taschenrechner! Mit realer Milliarden Industrial Holdings Limited Financials und einstellbaren Prognoseeingaben können Sie Szenarien testen und Milliarden für den Fair -Wert der industriellen Holdings in wenigen Minuten aufdecken.
Discounted Cash Flow (DCF) - (USD MM)
| Year | AY1 2020 |
AY2 2021 |
AY3 2022 |
AY4 2023 |
AY5 2024 |
FY1 2025 |
FY2 2026 |
FY3 2027 |
FY4 2028 |
FY5 2029 |
|---|---|---|---|---|---|---|---|---|---|---|
| Revenue | 9,221.3 | 15,576.5 | 17,023.9 | 19,419.8 | 22,565.5 | 22,121.0 | 21,685.3 | 21,258.1 | 20,839.4 | 20,428.9 |
| Revenue Growth, % | 0 | 68.92 | 9.29 | 14.07 | 16.2 | -1.97 | -1.97 | -1.97 | -1.97 | -1.97 |
| EBITDA | 1,766.0 | 3,278.2 | 1,836.4 | 1,435.5 | 1,980.3 | 2,970.9 | 2,912.4 | 2,855.0 | 2,798.8 | 2,743.7 |
| EBITDA, % | 19.15 | 21.05 | 10.79 | 7.39 | 8.78 | 13.43 | 13.43 | 13.43 | 13.43 | 13.43 |
| Depreciation | 552.8 | 696.5 | 785.2 | 854.1 | 918.2 | 1,041.7 | 1,021.2 | 1,001.1 | 981.4 | 962.0 |
| Depreciation, % | 5.99 | 4.47 | 4.61 | 4.4 | 4.07 | 4.71 | 4.71 | 4.71 | 4.71 | 4.71 |
| EBIT | 1,213.2 | 2,581.7 | 1,051.2 | 581.3 | 1,062.1 | 1,929.2 | 1,891.2 | 1,854.0 | 1,817.4 | 1,781.6 |
| EBIT, % | 13.16 | 16.57 | 6.17 | 2.99 | 4.71 | 8.72 | 8.72 | 8.72 | 8.72 | 8.72 |
| Total Cash | 375.1 | 832.3 | 358.4 | 208.4 | 266.1 | 609.1 | 597.1 | 585.4 | 573.8 | 562.5 |
| Total Cash, percent | .0 | .0 | .0 | .0 | .0 | .0 | .0 | .0 | .0 | .0 |
| Account Receivables | 486.2 | 706.2 | 1,381.4 | 1,284.1 | 1,782.8 | 1,435.0 | 1,406.7 | 1,379.0 | 1,351.8 | 1,325.2 |
| Account Receivables, % | 5.27 | 4.53 | 8.11 | 6.61 | 7.9 | 6.49 | 6.49 | 6.49 | 6.49 | 6.49 |
| Inventories | 2,084.2 | 3,072.2 | 4,387.4 | 4,894.2 | 5,812.9 | 5,267.4 | 5,163.7 | 5,062.0 | 4,962.2 | 4,864.5 |
| Inventories, % | 22.6 | 19.72 | 25.77 | 25.2 | 25.76 | 23.81 | 23.81 | 23.81 | 23.81 | 23.81 |
| Accounts Payable | 6,552.3 | 12,062.8 | 16,030.1 | 15,350.3 | 16,685.2 | 17,504.2 | 17,159.4 | 16,821.4 | 16,490.1 | 16,165.2 |
| Accounts Payable, % | 71.06 | 77.44 | 94.16 | 79.04 | 73.94 | 79.13 | 79.13 | 79.13 | 79.13 | 79.13 |
| Capital Expenditure | -1,858.4 | -1,313.1 | -2,969.1 | -1,127.0 | -194.8 | -2,331.2 | -2,285.2 | -2,240.2 | -2,196.1 | -2,152.8 |
| Capital Expenditure, % | -20.15 | -8.43 | -17.44 | -5.8 | -0.86319 | -10.54 | -10.54 | -10.54 | -10.54 | -10.54 |
| Tax Rate, % | 10.82 | 10.82 | 10.82 | 10.82 | 10.82 | 10.82 | 10.82 | 10.82 | 10.82 | 10.82 |
| EBITAT | 1,038.4 | 2,172.2 | 925.6 | 499.5 | 947.2 | 1,670.2 | 1,637.3 | 1,605.1 | 1,573.5 | 1,542.5 |
| Depreciation | ||||||||||
| Changes in Account Receivables | ||||||||||
| Changes in Inventories | ||||||||||
| Changes in Accounts Payable | ||||||||||
| Capital Expenditure | ||||||||||
| UFCF | 3,714.7 | 5,857.9 | 718.6 | -862.7 | 1,588.1 | 2,093.2 | 160.5 | 157.4 | 154.3 | 151.2 |
| WACC, % | 5.36 | 5.34 | 5.39 | 5.36 | 5.41 | 5.37 | 5.37 | 5.37 | 5.37 | 5.37 |
| PV UFCF | ||||||||||
| SUM PV UFCF | 2,507.0 | |||||||||
| Long Term Growth Rate, % | 2.00 | |||||||||
| Free cash flow (T + 1) | 154 | |||||||||
| Terminal Value | 4,574 | |||||||||
| Present Terminal Value | 3,521 | |||||||||
| Enterprise Value | 6,028 | |||||||||
| Net Debt | 613 | |||||||||
| Equity Value | 5,415 | |||||||||
| Diluted Shares Outstanding, MM | 2,118 | |||||||||
| Equity Value Per Share | 2.56 |
What You Will Receive
- Accurate 2299HK Financial Data: Pre-loaded with historical and projected data for Billion Industrial Holdings Limited to ensure precise analysis.
- Customizable Template: Easily modify key inputs such as revenue growth, WACC, and EBITDA percentage.
- Instant Calculations: Witness the updates to Billion Industrial's intrinsic value in real-time as you make changes.
- Professional Valuation Tool: Tailored for investors, analysts, and consultants aiming for reliable DCF results.
- User-Friendly Interface: A straightforward layout with clear guidelines suitable for users of all experience levels.
Key Features
- Customizable Forecast Inputs: Adjust essential parameters such as revenue growth, EBITDA margin, and capital expenditures for accurate projections.
- Instant DCF Valuation: Automatically computes intrinsic value, net present value (NPV), and additional financial metrics at the click of a button.
- High-Precision Analysis: Leverages Billion Industrial Holdings Limited’s (2299HK) actual financial data to deliver reliable valuation results.
- Simplified Scenario Analysis: Effortlessly explore various assumptions and analyze different outcomes for informed decision-making.
- Efficiency Booster: Save time by avoiding the complexities of constructing valuation models from the ground up.
How It Works
- Step 1: Download the Excel spreadsheet.
- Step 2: Examine the pre-filled data for Billion Industrial Holdings Limited (2299HK) including historical and projected figures.
- Step 3: Modify key assumptions (highlighted in yellow) based on your evaluations.
- Step 4: Observe the automatic recalculations of Billion Industrial Holdings Limited’s intrinsic value.
- Step 5: Utilize the results for making investment decisions or for reporting purposes.
Why Opt for This Calculator?
- Precision: Utilizes authentic Billion Industrial Holdings Limited (2299HK) financials for reliable data.
- Versatility: Crafted to allow users to easily adjust and test various inputs.
- Efficiency: Eliminate the need to create a DCF model from the ground up.
- Expert-Level: Engineered with the accuracy and ease of use expected by CFOs.
- Intuitive: Simple to navigate, even for individuals without extensive financial modeling expertise.
Who Can Benefit from This Product?
- Finance Students: Master valuation techniques and apply them using real data relevant to Billion Industrial Holdings Limited (2299HK).
- Academics: Integrate professional models into your research or educational curriculum using insights from (2299HK).
- Investors: Validate your assumptions and assess valuation results for Billion Industrial Holdings Limited (2299HK).
- Analysts: Enhance your efficiency with a pre-configured, customizable DCF model tailored for (2299HK).
- Small Business Owners: Discover how major public companies, like Billion Industrial Holdings Limited (2299HK), are evaluated in the market.
Contents of the Template
- Operating and Balance Sheet Data: Pre-filled historical data and forecasts for Billion Industrial Holdings Limited (2299HK), including revenue, EBITDA, EBIT, and capital expenditures.
- WACC Calculation: A dedicated sheet for Weighted Average Cost of Capital (WACC), featuring parameters such as Beta, risk-free rate, and share price.
- DCF Valuation (Unlevered and Levered): Customizable Discounted Cash Flow models that display intrinsic value along with comprehensive calculations.
- Financial Statements: Pre-loaded annual and quarterly financial statements to facilitate thorough analysis.
- Key Ratios: Includes profitability, leverage, and efficiency ratios specific to Billion Industrial Holdings Limited (2299HK).
- Dashboard and Charts: A visual overview of valuation outputs and assumptions, designed for easy results analysis.
Disclaimer
All information, articles, and product details provided on this website are for general informational and educational purposes only. We do not claim any ownership over, nor do we intend to infringe upon, any trademarks, copyrights, logos, brand names, or other intellectual property mentioned or depicted on this site. Such intellectual property remains the property of its respective owners, and any references here are made solely for identification or informational purposes, without implying any affiliation, endorsement, or partnership.
We make no representations or warranties, express or implied, regarding the accuracy, completeness, or suitability of any content or products presented. Nothing on this website should be construed as legal, tax, investment, financial, medical, or other professional advice. In addition, no part of this site—including articles or product references—constitutes a solicitation, recommendation, endorsement, advertisement, or offer to buy or sell any securities, franchises, or other financial instruments, particularly in jurisdictions where such activity would be unlawful.
All content is of a general nature and may not address the specific circumstances of any individual or entity. It is not a substitute for professional advice or services. Any actions you take based on the information provided here are strictly at your own risk. You accept full responsibility for any decisions or outcomes arising from your use of this website and agree to release us from any liability in connection with your use of, or reliance upon, the content or products found herein.