
|
Weichai Power Co., Ltd. (2338.HK) DCF -Bewertung |
Fully Editable: Tailor To Your Needs In Excel Or Sheets
Professional Design: Trusted, Industry-Standard Templates
Investor-Approved Valuation Models
MAC/PC Compatible, Fully Unlocked
No Expertise Is Needed; Easy To Follow
Weichai Power Co., Ltd. (2338.HK) Bundle
Übernehmen Sie den Befehl Ihrer Weichai Power Co., Ltd. (2338HK) Bewertungsanalyse mit unserem erweiterten DCF -Taschenrechner! Diese Excel -Vorlage mit realen (2338HK-) Daten vorinstalliert und ermöglicht es Ihnen, Prognosen und Annahmen anzupassen, um Weichai Power Co., Ltd., mit Genauigkeit zu berechnen.
Benefits You Will Receive
- Comprehensive Financial Model: Utilizing Weichai Power's actual data for accurate DCF valuation.
- Complete Forecasting Control: Modify revenue growth, profit margins, WACC, and other essential factors.
- Real-Time Calculations: Automated updates provide immediate insights as you adjust parameters.
- Professional-Grade Template: An expertly crafted Excel document suitable for investor presentations.
- Flexible and Reusable: Designed for adaptability, allowing for consistent use in thorough forecasting.
Key Features
- Comprehensive Weichai Power Data: Pre-loaded with historical financials and future projections for Weichai Power Co., Ltd. (2338HK).
- Customizable Inputs: Modify revenue growth, profit margins, WACC, tax rates, and capital expenditures to suit your analysis.
- Interactive Valuation Model: Automatically refreshes Net Present Value (NPV) and intrinsic value based on your updated inputs.
- Scenario Analysis: Develop various forecasting scenarios to evaluate different valuation results.
- Intuitive Interface: Designed to be straightforward and accessible for both experienced analysts and newcomers.
How It Works
- Step 1: Download the Excel file.
- Step 2: Examine Weichai Power Co., Ltd.'s pre-filled financial data and projections.
- Step 3: Adjust key inputs such as revenue growth, WACC, and tax rates (highlighted cells).
- Step 4: Observe the DCF model update in real time as you change your assumptions.
- Step 5: Evaluate the results and utilize them for your investment strategies.
Why Opt for This Weichai Power Calculator?
- Precision: Utilizes verified Weichai financial data for utmost accuracy.
- Versatility: Built to allow users to freely adjust and explore various inputs.
- Efficiency: Eliminate the complexities of constructing a DCF model from the ground up.
- High-Quality: Crafted with the thoroughness and usability standards expected by financial executives.
- Intuitive: Simple to navigate, making it accessible for users without extensive financial modeling expertise.
Who Could Benefit from This Product?
- Investors: Assess Weichai Power’s valuation prior to making stock transactions.
- CFOs and Financial Analysts: Enhance valuation workflows and evaluate forecasts.
- Startup Founders: Understand how large public companies like Weichai Power are appraised.
- Consultants: Create comprehensive valuation reports for clients.
- Students and Educators: Utilize real-world data to learn and instruct valuation methodologies.
Contents of the Template
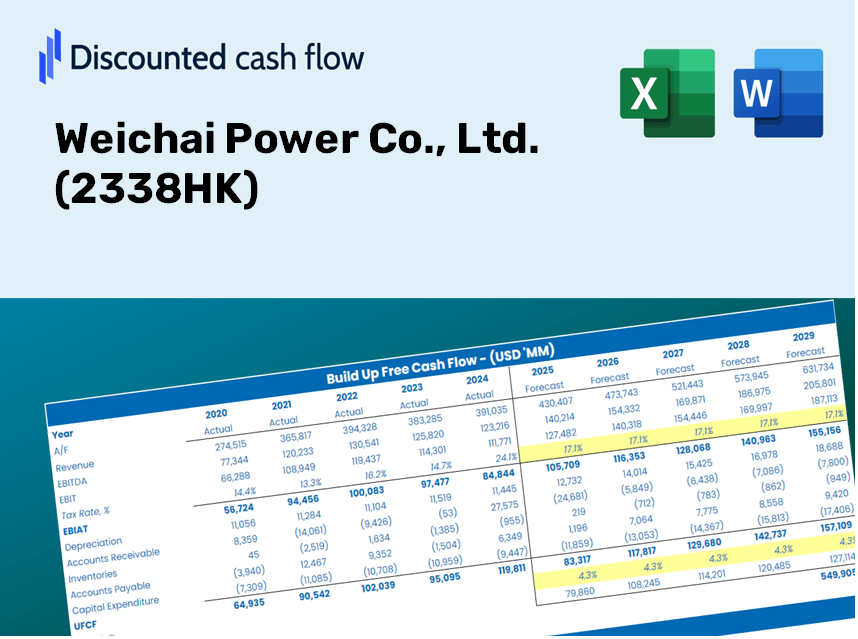
- Operating and Balance Sheet Data: Pre-filled Weichai Power historical data and forecasts, encompassing revenue, EBITDA, EBIT, and capital expenditures.
- WACC Calculation: A specific sheet for Weighted Average Cost of Capital (WACC), featuring parameters such as Beta, risk-free rate, and share price.
- DCF Valuation (Unlevered and Levered): Customizable Discounted Cash Flow models illustrating intrinsic value along with comprehensive calculations.
- Financial Statements: Pre-loaded financial statements (annual and quarterly) to facilitate analysis.
- Key Ratios: Incorporates profitability, leverage, and efficiency ratios for Weichai Power.
- Dashboard and Charts: Visual representation of valuation outputs and assumptions for easy result analysis.
Disclaimer
All information, articles, and product details provided on this website are for general informational and educational purposes only. We do not claim any ownership over, nor do we intend to infringe upon, any trademarks, copyrights, logos, brand names, or other intellectual property mentioned or depicted on this site. Such intellectual property remains the property of its respective owners, and any references here are made solely for identification or informational purposes, without implying any affiliation, endorsement, or partnership.
We make no representations or warranties, express or implied, regarding the accuracy, completeness, or suitability of any content or products presented. Nothing on this website should be construed as legal, tax, investment, financial, medical, or other professional advice. In addition, no part of this site—including articles or product references—constitutes a solicitation, recommendation, endorsement, advertisement, or offer to buy or sell any securities, franchises, or other financial instruments, particularly in jurisdictions where such activity would be unlawful.
All content is of a general nature and may not address the specific circumstances of any individual or entity. It is not a substitute for professional advice or services. Any actions you take based on the information provided here are strictly at your own risk. You accept full responsibility for any decisions or outcomes arising from your use of this website and agree to release us from any liability in connection with your use of, or reliance upon, the content or products found herein.