
|
Giant Biogen Holding Co., Ltd. (2367.HK) DCF -Bewertung |
Fully Editable: Tailor To Your Needs In Excel Or Sheets
Professional Design: Trusted, Industry-Standard Templates
Investor-Approved Valuation Models
MAC/PC Compatible, Fully Unlocked
No Expertise Is Needed; Easy To Follow
Giant Biogene Holding Co., Ltd. (2367.HK) Bundle
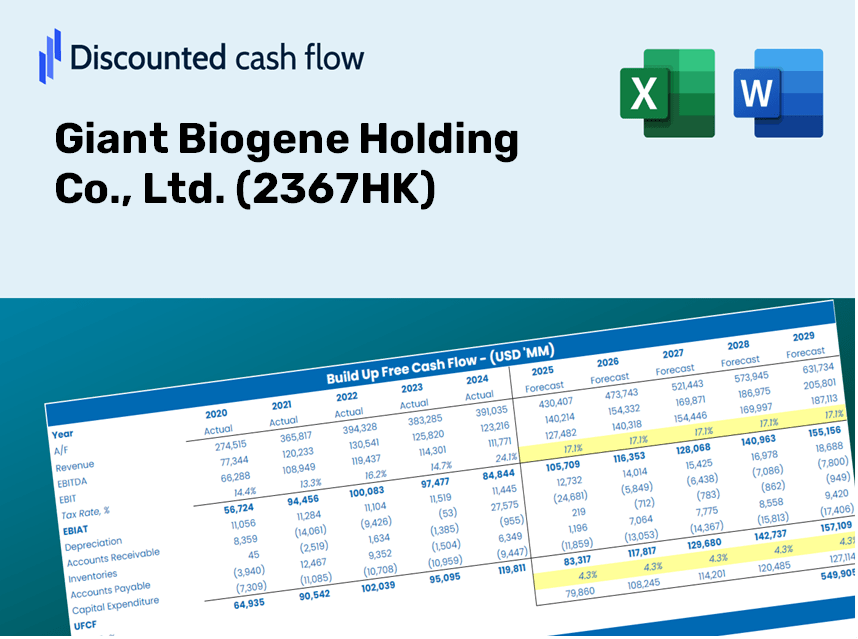
Gewinnen Sie Einblick in Ihre Riesenbiogen Holding Co., Ltd. (2367HK) Bewertungsanalyse mit unserem ausgefeilten DCF -Taschenrechner! Diese Excel -Vorlage wird mit realen (2367HK-) Daten vorinstalliert, sodass Sie Prognosen und Annahmen anpassen können, um den inneren Wert von Giant Biogen Holding Co., Ltd. genau zu bestimmen.
Discounted Cash Flow (DCF) - (USD MM)
| Year | AY1 2020 |
AY2 2021 |
AY3 2022 |
AY4 2023 |
AY5 2024 |
FY1 2025 |
FY2 2026 |
FY3 2027 |
FY4 2028 |
FY5 2029 |
|---|---|---|---|---|---|---|---|---|---|---|
| Revenue | 1,300.6 | 1,696.1 | 2,583.2 | 3,850.3 | 6,051.4 | 8,909.5 | 13,117.5 | 19,313.1 | 28,434.8 | 41,864.9 |
| Revenue Growth, % | 0 | 30.41 | 52.3 | 49.05 | 57.17 | 47.23 | 47.23 | 47.23 | 47.23 | 47.23 |
| EBITDA | 902.5 | 1,020.0 | 1,316.9 | 1,944.0 | 2,523.3 | 4,859.1 | 7,154.1 | 10,533.1 | 15,508.0 | 22,832.5 |
| EBITDA, % | 69.39 | 60.14 | 50.98 | 50.49 | 41.7 | 54.54 | 54.54 | 54.54 | 54.54 | 54.54 |
| Depreciation | 23.2 | 25.2 | 30.2 | 37.3 | 34.5 | 106.6 | 156.9 | 231.1 | 340.2 | 500.9 |
| Depreciation, % | 1.79 | 1.49 | 1.17 | 0.96974 | 0.57081 | 1.2 | 1.2 | 1.2 | 1.2 | 1.2 |
| EBIT | 879.2 | 994.8 | 1,286.8 | 1,906.7 | 2,488.7 | 4,752.5 | 6,997.2 | 10,302.0 | 15,167.8 | 22,331.7 |
| EBIT, % | 67.6 | 58.65 | 49.81 | 49.52 | 41.13 | 53.34 | 53.34 | 53.34 | 53.34 | 53.34 |
| Total Cash | 2,137.2 | 7,930.3 | 2,400.2 | 4,128.5 | 6,401.0 | 8,783.2 | 12,931.6 | 19,039.4 | 28,031.9 | 41,271.6 |
| Total Cash, percent | .0 | .0 | .0 | .0 | .0 | .0 | .0 | .0 | .0 | .0 |
| Account Receivables | 278.8 | 76.1 | 75.8 | 81.7 | 175.5 | 603.7 | 888.8 | 1,308.6 | 1,926.7 | 2,836.7 |
| Account Receivables, % | 21.44 | 4.48 | 2.94 | 2.12 | 2.9 | 6.78 | 6.78 | 6.78 | 6.78 | 6.78 |
| Inventories | 70.6 | 97.7 | 200.9 | 219.0 | 339.6 | 539.3 | 794.0 | 1,169.1 | 1,721.2 | 2,534.2 |
| Inventories, % | 5.43 | 5.76 | 7.78 | 5.69 | 5.61 | 6.05 | 6.05 | 6.05 | 6.05 | 6.05 |
| Accounts Payable | 34.9 | 25.8 | 59.7 | 145.4 | 313.2 | 275.6 | 405.8 | 597.5 | 879.7 | 1,295.2 |
| Accounts Payable, % | 2.68 | 1.52 | 2.31 | 3.78 | 5.18 | 3.09 | 3.09 | 3.09 | 3.09 | 3.09 |
| Capital Expenditure | -83.4 | -121.5 | -167.4 | -249.6 | -269.6 | -552.3 | -813.1 | -1,197.1 | -1,762.5 | -2,595.0 |
| Capital Expenditure, % | -6.41 | -7.16 | -6.48 | -6.48 | -4.46 | -6.2 | -6.2 | -6.2 | -6.2 | -6.2 |
| Tax Rate, % | 16.09 | 16.09 | 16.09 | 16.09 | 16.09 | 16.09 | 16.09 | 16.09 | 16.09 | 16.09 |
| EBITAT | 746.6 | 846.8 | 1,094.8 | 1,586.2 | 2,088.3 | 4,013.2 | 5,908.7 | 8,699.4 | 12,808.2 | 18,857.7 |
| Depreciation | ||||||||||
| Changes in Account Receivables | ||||||||||
| Changes in Inventories | ||||||||||
| Changes in Accounts Payable | ||||||||||
| Capital Expenditure | ||||||||||
| UFCF | 371.9 | 917.1 | 888.4 | 1,435.8 | 1,806.6 | 2,902.0 | 4,842.9 | 7,130.2 | 10,497.9 | 15,456.1 |
| WACC, % | 6.64 | 6.64 | 6.64 | 6.64 | 6.64 | 6.64 | 6.64 | 6.64 | 6.64 | 6.64 |
| PV UFCF | ||||||||||
| SUM PV UFCF | 32,181.7 | |||||||||
| Long Term Growth Rate, % | 2.00 | |||||||||
| Free cash flow (T + 1) | 15,765 | |||||||||
| Terminal Value | 339,612 | |||||||||
| Present Terminal Value | 246,229 | |||||||||
| Enterprise Value | 278,411 | |||||||||
| Net Debt | -4,396 | |||||||||
| Equity Value | 282,806 | |||||||||
| Diluted Shares Outstanding, MM | 1,002 | |||||||||
| Equity Value Per Share | 282.33 |
What You Will Receive
- Genuine 2367HK Financials: Comprehensive historical and projected data for precise valuation.
- Customizable Inputs: Adjust WACC, tax rates, revenue growth, and capital expenditures as needed.
- Real-Time Calculations: Intrinsic value and NPV are computed automatically.
- Dynamic Scenario Analysis: Explore various scenarios to assess Giant Biogene's future performance.
- User-Friendly Design: Designed for professionals while remaining approachable for newcomers.
Key Features
- Customizable Financial Inputs: Adjust vital parameters such as revenue growth rates, EBITDA margins, and capital expenditures.
- Instant DCF Valuation: Quickly computes intrinsic value, NPV, and various financial metrics.
- High-Precision Accuracy: Leverages Giant Biogene Holding Co., Ltd.'s (2367HK) real financial data for dependable valuation results.
- Seamless Scenario Analysis: Effortlessly evaluate different assumptions and analyze varying outcomes.
- Efficiency Booster: Avoid the complexities of creating detailed valuation models from the ground up.
How It Works
- Step 1: Download the prebuilt Excel template featuring Giant Biogene Holding Co., Ltd.'s (2367HK) data.
- Step 2: Examine the pre-filled spreadsheets to familiarize yourself with the essential metrics.
- Step 3: Update your forecasts and assumptions in the editable yellow cells (WACC, growth, margins).
- Step 4: Instantly see recalculated results, including Giant Biogene Holding Co., Ltd.'s (2367HK) intrinsic value.
- Step 5: Use the outputs to make informed investment decisions or generate comprehensive reports.
Why Choose Giant Biogene Holding Co., Ltd. ([2367HK])?
- Save Time: No need to build complex financial models – our tools are ready to go.
- Enhance Accuracy: Dependable data and calculations minimize discrepancies in your valuations.
- Completely Customizable: Adjust the model to align with your unique assumptions and forecasts.
- User-Friendly: Intuitive charts and outputs simplify data interpretation and analysis.
- Endorsed by Industry Experts: Crafted for professionals who prioritize both accuracy and ease of use.
Who Can Benefit from Our Services?
- Individual Investors: Gain valuable insights for making informed decisions regarding investments in Giant Biogene Holding Co., Ltd. (2367HK).
- Financial Analysts: Enhance valuation processes with our user-friendly financial models tailored for 2367HK.
- Consultants: Provide accurate and timely valuation insights to clients focusing on the biotechnology sector, specifically for Giant Biogene Holding Co., Ltd. (2367HK).
- Business Owners: Learn how major biotech firms like Giant Biogene Holding Co., Ltd. (2367HK) are valued to inform your own business strategies.
- Finance Students: Explore valuation techniques using real-world data and scenarios related to Giant Biogene Holding Co., Ltd. (2367HK).
Contents of the Template
- Pre-Filled Data: Contains Giant Biogene's historical financials and projections.
- Discounted Cash Flow Model: An editable DCF valuation model featuring automatic calculations.
- Weighted Average Cost of Capital (WACC): A specialized sheet for computing WACC using custom inputs.
- Key Financial Ratios: Evaluate Giant Biogene's profitability, operational efficiency, and financial leverage.
- Customizable Inputs: Easily adjust revenue growth, profit margins, and tax rates.
- Clear Dashboard: Visual representations, including charts and tables that summarize essential valuation outcomes.
Disclaimer
All information, articles, and product details provided on this website are for general informational and educational purposes only. We do not claim any ownership over, nor do we intend to infringe upon, any trademarks, copyrights, logos, brand names, or other intellectual property mentioned or depicted on this site. Such intellectual property remains the property of its respective owners, and any references here are made solely for identification or informational purposes, without implying any affiliation, endorsement, or partnership.
We make no representations or warranties, express or implied, regarding the accuracy, completeness, or suitability of any content or products presented. Nothing on this website should be construed as legal, tax, investment, financial, medical, or other professional advice. In addition, no part of this site—including articles or product references—constitutes a solicitation, recommendation, endorsement, advertisement, or offer to buy or sell any securities, franchises, or other financial instruments, particularly in jurisdictions where such activity would be unlawful.
All content is of a general nature and may not address the specific circumstances of any individual or entity. It is not a substitute for professional advice or services. Any actions you take based on the information provided here are strictly at your own risk. You accept full responsibility for any decisions or outcomes arising from your use of this website and agree to release us from any liability in connection with your use of, or reliance upon, the content or products found herein.