
|
Asahi Group Holdings, Ltd. (2502.t) DCF -Bewertung |
Fully Editable: Tailor To Your Needs In Excel Or Sheets
Professional Design: Trusted, Industry-Standard Templates
Investor-Approved Valuation Models
MAC/PC Compatible, Fully Unlocked
No Expertise Is Needed; Easy To Follow
Asahi Group Holdings, Ltd. (2502.T) Bundle
Verbessern Sie Ihre Anlagestrategien mit dem DCF -Taschenrechner der Asahi Group Holdings, Ltd. (2502T)! Überprüfen Sie authentische Asahi -Finanzdaten, passen Sie Wachstumsprojektionen und -kosten an und beachten Sie sofort, wie sich diese Variationen auf den inneren Wert der Asahi Group Holdings, Ltd. (2502T) auswirken.
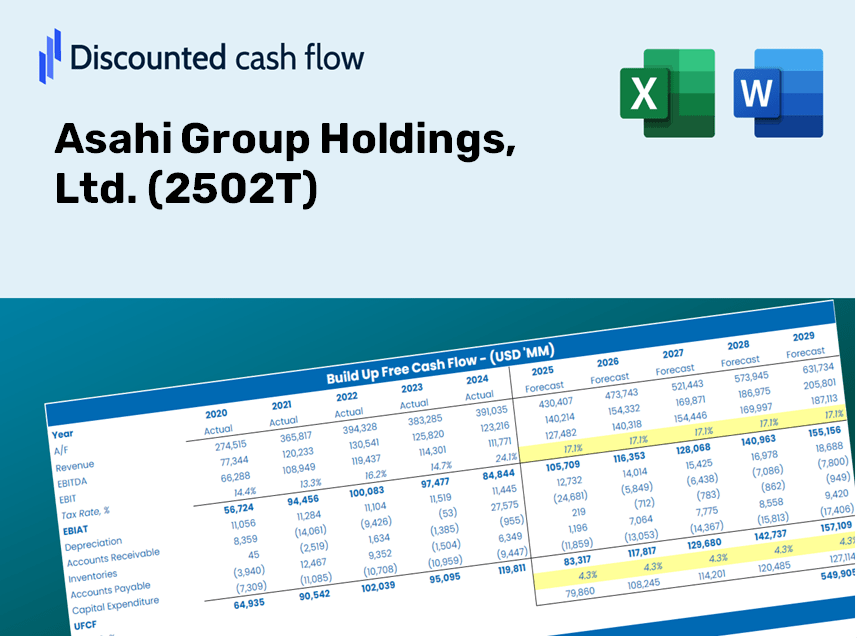
Discounted Cash Flow (DCF) - (USD MM)
| Year | AY1 2020 |
AY2 2021 |
AY3 2022 |
AY4 2023 |
AY5 2024 |
FY1 2025 |
FY2 2026 |
FY3 2027 |
FY4 2028 |
FY5 2029 |
|---|---|---|---|---|---|---|---|---|---|---|
| Revenue | 2,027,762.0 | 2,236,076.0 | 2,511,108.0 | 2,769,091.0 | 2,939,422.0 | 2,982,859.0 | 3,026,937.8 | 3,071,668.0 | 3,117,059.2 | 3,163,121.2 |
| Revenue Growth, % | 0 | 10.27 | 12.3 | 10.27 | 6.15 | 1.48 | 1.48 | 1.48 | 1.48 | 1.48 |
| EBITDA | 263,658.0 | 350,383.0 | 363,632.0 | 404,535.0 | 418,421.0 | 429,511.7 | 435,858.8 | 442,299.6 | 448,835.6 | 455,468.3 |
| EBITDA, % | 13 | 15.67 | 14.48 | 14.61 | 14.23 | 14.4 | 14.4 | 14.4 | 14.4 | 14.4 |
| Depreciation | 123,277.0 | 134,815.0 | 140,419.0 | 147,992.0 | 157,935.0 | 169,533.1 | 172,038.3 | 174,580.6 | 177,160.5 | 179,778.4 |
| Depreciation, % | 6.08 | 6.03 | 5.59 | 5.34 | 5.37 | 5.68 | 5.68 | 5.68 | 5.68 | 5.68 |
| EBIT | 140,381.0 | 215,568.0 | 223,213.0 | 256,543.0 | 260,486.0 | 259,978.6 | 263,820.4 | 267,719.0 | 271,675.2 | 275,689.8 |
| EBIT, % | 6.92 | 9.64 | 8.89 | 9.26 | 8.86 | 8.72 | 8.72 | 8.72 | 8.72 | 8.72 |
| Total Cash | 48,460.0 | 52,743.0 | 37,438.0 | 59,945.0 | 101,040.0 | 70,644.0 | 71,687.9 | 72,747.3 | 73,822.3 | 74,913.2 |
| Total Cash, percent | .0 | .0 | .0 | .0 | .0 | .0 | .0 | .0 | .0 | .0 |
| Account Receivables | 378,924.0 | 395,974.0 | 415,676.0 | 465,633.0 | 445,179.0 | 506,544.5 | 514,029.9 | 521,625.9 | 529,334.2 | 537,156.3 |
| Account Receivables, % | 18.69 | 17.71 | 16.55 | 16.82 | 15.15 | 16.98 | 16.98 | 16.98 | 16.98 | 16.98 |
| Inventories | 183,166.0 | 200,828.0 | 234,969.0 | 267,317.0 | 271,430.0 | 275,968.7 | 280,046.8 | 284,185.2 | 288,384.7 | 292,646.3 |
| Inventories, % | 9.03 | 8.98 | 9.36 | 9.65 | 9.23 | 9.25 | 9.25 | 9.25 | 9.25 | 9.25 |
| Accounts Payable | 235,478.0 | 251,922.0 | 591,869.0 | 714,781.0 | 720,870.0 | 577,398.2 | 585,930.6 | 594,589.2 | 603,375.6 | 612,291.9 |
| Accounts Payable, % | 11.61 | 11.27 | 23.57 | 25.81 | 24.52 | 19.36 | 19.36 | 19.36 | 19.36 | 19.36 |
| Capital Expenditure | -90,743.0 | -92,635.0 | -99,845.0 | -109,828.0 | -108,325.0 | -120,778.2 | -122,563.0 | -124,374.1 | -126,212.1 | -128,077.1 |
| Capital Expenditure, % | -4.48 | -4.14 | -3.98 | -3.97 | -3.69 | -4.05 | -4.05 | -4.05 | -4.05 | -4.05 |
| Tax Rate, % | 28.06 | 28.06 | 28.06 | 28.06 | 28.06 | 28.06 | 28.06 | 28.06 | 28.06 | 28.06 |
| EBITAT | 103,916.4 | 165,592.5 | 164,225.0 | 174,025.7 | 187,400.8 | 189,364.4 | 192,162.7 | 195,002.4 | 197,884.0 | 200,808.2 |
| Depreciation | ||||||||||
| Changes in Account Receivables | ||||||||||
| Changes in Inventories | ||||||||||
| Changes in Accounts Payable | ||||||||||
| Capital Expenditure | ||||||||||
| UFCF | -190,161.6 | 189,504.5 | 490,903.0 | 252,796.7 | 259,440.8 | 28,743.3 | 238,607.0 | 242,133.0 | 245,711.1 | 249,342.1 |
| WACC, % | 4.89 | 4.92 | 4.89 | 4.82 | 4.87 | 4.88 | 4.88 | 4.88 | 4.88 | 4.88 |
| PV UFCF | ||||||||||
| SUM PV UFCF | 853,865.4 | |||||||||
| Long Term Growth Rate, % | 3.00 | |||||||||
| Free cash flow (T + 1) | 256,822 | |||||||||
| Terminal Value | 13,686,645 | |||||||||
| Present Terminal Value | 10,787,163 | |||||||||
| Enterprise Value | 11,641,028 | |||||||||
| Net Debt | 1,195,215 | |||||||||
| Equity Value | 10,445,813 | |||||||||
| Diluted Shares Outstanding, MM | 1,517 | |||||||||
| Equity Value Per Share | 6,886.43 |
What You Will Receive
- Customizable Excel Template: A fully editable Excel-based DCF Calculator featuring pre-filled financial data for Asahi Group Holdings, Ltd. (2502T).
- Comprehensive Data: Access to historical figures and projections (highlighted in the yellow cells).
- Adaptable Forecasts: Modify key assumptions such as revenue growth, EBITDA %, and WACC.
- Instant Calculations: Quickly observe how your adjustments influence the valuation of Asahi Group Holdings, Ltd. (2502T).
- Professional Resource: Designed for investors, CFOs, consultants, and financial analysts.
- Intuitive Design: Organized for simplicity and efficiency, complete with step-by-step guidance.
Key Features
- Accurate Asahi Financials: Gain access to reliable historical data and forward-looking projections for Asahi Group Holdings, Ltd. (2502T).
- Customizable Forecast Inputs: Modify highlighted fields such as WACC, growth rates, and profit margins to tailor your analysis.
- Real-Time Calculations: Enjoy automatic updates for DCF, Net Present Value (NPV), and cash flow assessments.
- Interactive Visual Dashboard: Utilize easy-to-read charts and summaries for a clear view of your valuation outcomes.
- Designed for All Skill Levels: An intuitive layout that caters to investors, CFOs, and consultants alike.
How It Works
- Step 1: Download the Excel file.
- Step 2: Examine the pre-filled financial data and forecasts for Asahi Group Holdings, Ltd. (2502T).
- Step 3: Adjust key variables such as revenue growth, WACC, and tax rates (highlighted cells).
- Step 4: Observe the DCF model refresh in real-time as you modify your assumptions.
- Step 5: Evaluate the results and incorporate the findings into your investment decisions.
Why Opt for This Calculator?
- All-in-One Solution: Combines DCF, WACC, and financial ratio analyses for a comprehensive assessment.
- Flexible Customization: Modify the yellow-highlighted cells to explore different financial scenarios.
- In-Depth Analysis: Automatically computes Asahi Group Holdings, Ltd.'s intrinsic value and Net Present Value.
- Preloaded Information: Features historical and projected data for reliable starting points.
- Designed for Professionals: Perfect for financial analysts, investors, and business consultants alike.
Who Should Utilize This Product?
- Investors: Evaluate the fair value of Asahi Group Holdings, Ltd. (2502T) before making informed investment choices.
- CFOs: Utilize a high-quality DCF model for comprehensive financial reporting and analysis.
- Consultants: Seamlessly customize the template for client valuation reports.
- Entrepreneurs: Obtain valuable insights into financial modeling practices used by leading global companies.
- Educators: Employ it as a teaching resource to illustrate valuation techniques.
Contents of the Template
- Preloaded 2502T Data: Historical and forecasted financial metrics, including revenue, EBIT, and capital expenditures.
- DCF and WACC Models: Advanced templates for calculating intrinsic value and Weighted Average Cost of Capital.
- Editable Inputs: Yellow-highlighted cells for modifying revenue growth, tax rates, and discount rates.
- Financial Statements: Detailed annual and quarterly financial reports for enhanced analysis.
- Key Ratios: Metrics for profitability, leverage, and efficiency to assess performance.
- Dashboard and Charts: Visual representations of valuation results and assumptions.
Disclaimer
All information, articles, and product details provided on this website are for general informational and educational purposes only. We do not claim any ownership over, nor do we intend to infringe upon, any trademarks, copyrights, logos, brand names, or other intellectual property mentioned or depicted on this site. Such intellectual property remains the property of its respective owners, and any references here are made solely for identification or informational purposes, without implying any affiliation, endorsement, or partnership.
We make no representations or warranties, express or implied, regarding the accuracy, completeness, or suitability of any content or products presented. Nothing on this website should be construed as legal, tax, investment, financial, medical, or other professional advice. In addition, no part of this site—including articles or product references—constitutes a solicitation, recommendation, endorsement, advertisement, or offer to buy or sell any securities, franchises, or other financial instruments, particularly in jurisdictions where such activity would be unlawful.
All content is of a general nature and may not address the specific circumstances of any individual or entity. It is not a substitute for professional advice or services. Any actions you take based on the information provided here are strictly at your own risk. You accept full responsibility for any decisions or outcomes arising from your use of this website and agree to release us from any liability in connection with your use of, or reliance upon, the content or products found herein.