
|
Gentec Universal Medical Group Company Limited (2666.HK) DCF -Bewertung |
Fully Editable: Tailor To Your Needs In Excel Or Sheets
Professional Design: Trusted, Industry-Standard Templates
Investor-Approved Valuation Models
MAC/PC Compatible, Fully Unlocked
No Expertise Is Needed; Easy To Follow
Genertec Universal Medical Group Company Limited (2666.HK) Bundle
Unser (2666HK) DCF-Taschenrechner für Genauigkeit entwickelt und ermöglicht es Ihnen, die Bewertung von GenerTEC Universal Medical Group Company Limited unter Verwendung realer Finanzdaten zu bewerten und eine vollständige Flexibilität zu bieten, um alle wesentlichen Parameter für verbesserte Prognosen zu ändern.
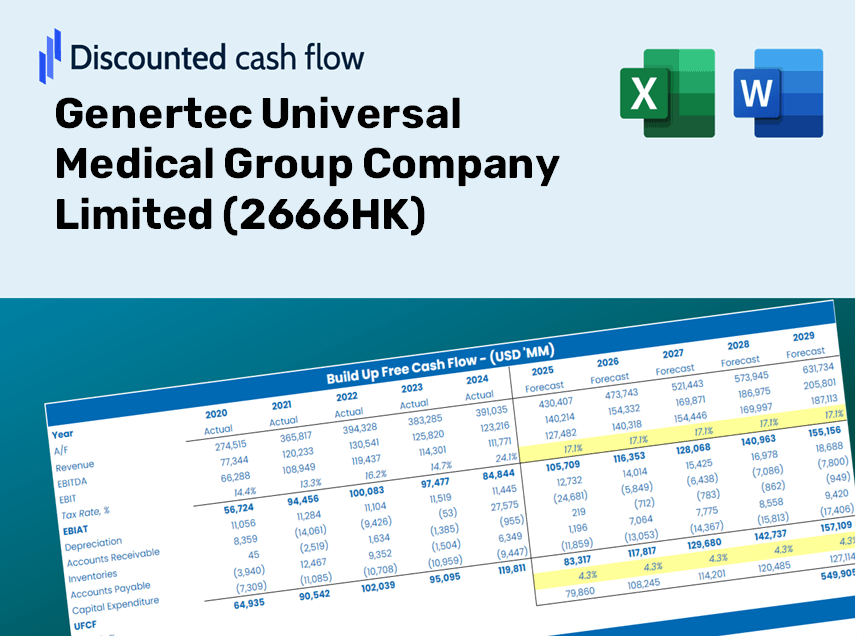
Discounted Cash Flow (DCF) - (USD MM)
| Year | AY1 2020 |
AY2 2021 |
AY3 2022 |
AY4 2023 |
AY5 2024 |
FY1 2025 |
FY2 2026 |
FY3 2027 |
FY4 2028 |
FY5 2029 |
|---|---|---|---|---|---|---|---|---|---|---|
| Revenue | 9,013.1 | 10,460.4 | 12,646.0 | 14,925.1 | 14,939.6 | 16,996.5 | 19,336.5 | 21,998.7 | 25,027.4 | 28,473.1 |
| Revenue Growth, % | 0 | 16.06 | 20.89 | 18.02 | 0.09730258 | 13.77 | 13.77 | 13.77 | 13.77 | 13.77 |
| EBITDA | 2,914.7 | 3,324.4 | 3,478.1 | 3,732.8 | 3,892.6 | 4,850.4 | 5,518.2 | 6,277.9 | 7,142.2 | 8,125.6 |
| EBITDA, % | 32.34 | 31.78 | 27.5 | 25.01 | 26.06 | 28.54 | 28.54 | 28.54 | 28.54 | 28.54 |
| Depreciation | 295.4 | 349.3 | 483.3 | 556.2 | 658.5 | 631.4 | 718.3 | 817.2 | 929.7 | 1,057.7 |
| Depreciation, % | 3.28 | 3.34 | 3.82 | 3.73 | 4.41 | 3.71 | 3.71 | 3.71 | 3.71 | 3.71 |
| EBIT | 2,619.3 | 2,975.1 | 2,994.7 | 3,176.6 | 3,234.1 | 4,219.0 | 4,799.9 | 5,460.7 | 6,212.5 | 7,067.9 |
| EBIT, % | 29.06 | 28.44 | 23.68 | 21.28 | 21.65 | 24.82 | 24.82 | 24.82 | 24.82 | 24.82 |
| Total Cash | 2,226.7 | 2,560.8 | 2,958.0 | 3,932.6 | 2,602.9 | 3,955.1 | 4,499.6 | 5,119.1 | 5,823.9 | 6,625.7 |
| Total Cash, percent | .0 | .0 | .0 | .0 | .0 | .0 | .0 | .0 | .0 | .0 |
| Account Receivables | 20,624.8 | 23,284.5 | 26,413.6 | 748.8 | 31,904.0 | 13,767.7 | 15,663.2 | 17,819.7 | 20,273.1 | 23,064.2 |
| Account Receivables, % | 228.83 | 222.6 | 208.87 | 5.02 | 213.55 | 81 | 81 | 81 | 81 | 81 |
| Inventories | .0 | 290.2 | 410.8 | 471.4 | 554.1 | 438.2 | 498.5 | 567.2 | 645.2 | 734.1 |
| Inventories, % | 0 | 2.77 | 3.25 | 3.16 | 3.71 | 2.58 | 2.58 | 2.58 | 2.58 | 2.58 |
| Accounts Payable | 949.5 | 1,215.8 | 2,508.7 | 3,267.8 | 3,035.0 | 2,862.4 | 3,256.5 | 3,704.8 | 4,214.9 | 4,795.2 |
| Accounts Payable, % | 10.53 | 11.62 | 19.84 | 21.89 | 20.32 | 16.84 | 16.84 | 16.84 | 16.84 | 16.84 |
| Capital Expenditure | -438.9 | -421.0 | -664.9 | -980.6 | -1,372.3 | -1,016.7 | -1,156.6 | -1,315.9 | -1,497.0 | -1,703.1 |
| Capital Expenditure, % | -4.87 | -4.02 | -5.26 | -6.57 | -9.19 | -5.98 | -5.98 | -5.98 | -5.98 | -5.98 |
| Tax Rate, % | 27.63 | 27.63 | 27.63 | 27.63 | 27.63 | 27.63 | 27.63 | 27.63 | 27.63 | 27.63 |
| EBITAT | 1,935.0 | 2,152.7 | 2,170.3 | 2,338.9 | 2,340.6 | 3,077.4 | 3,501.1 | 3,983.1 | 4,531.5 | 5,155.4 |
| Depreciation | ||||||||||
| Changes in Account Receivables | ||||||||||
| Changes in Inventories | ||||||||||
| Changes in Accounts Payable | ||||||||||
| Capital Expenditure | ||||||||||
| UFCF | -17,883.7 | -602.7 | 32.0 | 28,277.7 | -29,843.8 | 20,771.6 | 1,501.0 | 1,707.6 | 1,942.8 | 2,210.2 |
| WACC, % | 3.39 | 3.34 | 3.34 | 3.38 | 3.34 | 3.36 | 3.36 | 3.36 | 3.36 | 3.36 |
| PV UFCF | ||||||||||
| SUM PV UFCF | 26,623.8 | |||||||||
| Long Term Growth Rate, % | 2.00 | |||||||||
| Free cash flow (T + 1) | 2,254 | |||||||||
| Terminal Value | 165,834 | |||||||||
| Present Terminal Value | 140,580 | |||||||||
| Enterprise Value | 167,203 | |||||||||
| Net Debt | 59,181 | |||||||||
| Equity Value | 108,023 | |||||||||
| Diluted Shares Outstanding, MM | 2,010 | |||||||||
| Equity Value Per Share | 53.74 |
What You'll Receive
- Customizable Excel Template: A fully adjustable Excel-based DCF Calculator featuring pre-filled financial data for Genertec Universal Medical Group Company Limited (2666HK).
- Authentic Financial Data: Historical figures and forward-looking projections (highlighted in the yellow cells).
- Forecast Customization: Adjust forecast parameters such as revenue growth, EBITDA %, and WACC as needed.
- Instant Calculations: Quickly observe how your inputs affect the valuation of Genertec Universal Medical Group Company Limited (2666HK).
- Professional Resource: Designed for investors, CFOs, consultants, and financial analysts.
- User-Friendly Interface: Organized for simplicity and ease of navigation, complete with step-by-step guidance.
Key Features
- Comprehensive DCF Calculator: Features detailed unlevered and levered DCF valuation models tailored for Genertec Universal Medical Group Company Limited (2666HK).
- WACC Calculator: Includes a pre-designed Weighted Average Cost of Capital sheet with adjustable inputs specific to the healthcare sector.
- Customizable Forecast Assumptions: Easily adjust growth rates, capital expenditures, and discount rates for precise forecasting.
- Integrated Financial Ratios: Evaluate profitability, leverage, and efficiency ratios relevant to Genertec Universal Medical Group Company Limited (2666HK).
- Interactive Dashboard and Charts: Visual representations that highlight essential valuation metrics for straightforward analysis.
How It Functions
- 1. Access the Template: Download and open the Excel file containing Genertec Universal Medical Group Company Limited's preloaded data.
- 2. Modify Assumptions: Adjust key inputs such as growth rates, WACC, and capital expenditures as needed.
- 3. View Outcomes Instantly: The DCF model automatically calculates the intrinsic value and NPV based on your inputs.
- 4. Experiment with Scenarios: Evaluate multiple forecasts to explore various valuation results.
- 5. Present with Assurance: Deliver expert valuation insights to bolster your decision-making process.
Why Choose This Calculator for Genertec Universal Medical Group Company Limited (2666HK)?
- User-Friendly Interface: Crafted for both novice and experienced users.
- Customizable Inputs: Adjust assumptions effortlessly to suit your financial analysis.
- Real-Time Updates: Instantly view changes in Genertec’s valuation as you modify inputs.
- Preloaded Data: Comes with Genertec’s actual financial metrics for swift evaluations.
- Recommended by Experts: Utilized by analysts and investors for data-driven decision-making.
Who Can Benefit from Genertec Universal Medical Group Company Limited (2666HK)?
- Investors: Utilize a sophisticated valuation tool to make informed investment choices.
- Financial Analysts: Enhance efficiency with a customizable DCF model designed for quick use.
- Consultants: Easily tailor the template for presentations and reports for your clients.
- Finance Enthusiasts: Broaden your knowledge of valuation methodologies with practical, real-world insights.
- Educators and Students: Employ it as a hands-on educational resource in finance courses.
Contents of the Template
- Pre-Filled Data: Contains Genertec Universal Medical Group Company Limited’s historical financials and projections.
- Discounted Cash Flow Model: An editable DCF valuation model with automatic calculations included.
- Weighted Average Cost of Capital (WACC): A dedicated worksheet for calculating WACC based on user-defined inputs.
- Key Financial Ratios: Examine the profitability, efficiency, and leverage of Genertec Universal Medical Group Company Limited.
- Customizable Inputs: Easily modify revenue growth, profit margins, and tax rates.
- Clear Dashboard: Visual representations in charts and tables summarizing essential valuation outcomes.
Disclaimer
All information, articles, and product details provided on this website are for general informational and educational purposes only. We do not claim any ownership over, nor do we intend to infringe upon, any trademarks, copyrights, logos, brand names, or other intellectual property mentioned or depicted on this site. Such intellectual property remains the property of its respective owners, and any references here are made solely for identification or informational purposes, without implying any affiliation, endorsement, or partnership.
We make no representations or warranties, express or implied, regarding the accuracy, completeness, or suitability of any content or products presented. Nothing on this website should be construed as legal, tax, investment, financial, medical, or other professional advice. In addition, no part of this site—including articles or product references—constitutes a solicitation, recommendation, endorsement, advertisement, or offer to buy or sell any securities, franchises, or other financial instruments, particularly in jurisdictions where such activity would be unlawful.
All content is of a general nature and may not address the specific circumstances of any individual or entity. It is not a substitute for professional advice or services. Any actions you take based on the information provided here are strictly at your own risk. You accept full responsibility for any decisions or outcomes arising from your use of this website and agree to release us from any liability in connection with your use of, or reliance upon, the content or products found herein.