
|
Shanghai Electric Group Company Limited (2727.HK) DCF -Bewertung |
Fully Editable: Tailor To Your Needs In Excel Or Sheets
Professional Design: Trusted, Industry-Standard Templates
Investor-Approved Valuation Models
MAC/PC Compatible, Fully Unlocked
No Expertise Is Needed; Easy To Follow
Shanghai Electric Group Company Limited (2727.HK) Bundle
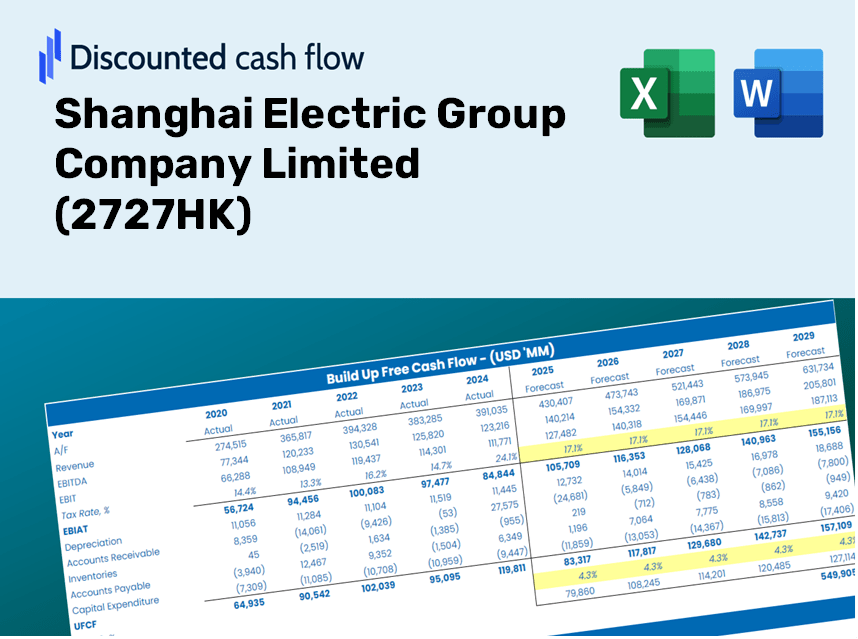
Bewerten Sie die finanziellen Aussichten der Shanghai Electric Group Company Limited (2727HK) mit professioneller Präzision! Dieser (2727HK) DCF-Taschenrechner bietet vorgefüllte Finanzdaten und bietet die vollständige Flexibilität, um das Umsatzwachstum, die WACC, die Margen und die anderen wichtigen Annahmen zu ändern, um sich an Ihren Projektionen anzupassen.
Discounted Cash Flow (DCF) - (USD MM)
| Year | AY1 2020 |
AY2 2021 |
AY3 2022 |
AY4 2023 |
AY5 2024 |
FY1 2025 |
FY2 2026 |
FY3 2027 |
FY4 2028 |
FY5 2029 |
|---|---|---|---|---|---|---|---|---|---|---|
| Revenue | 150,449.4 | 143,986.7 | 128,902.0 | 125,805.0 | 127,327.3 | 122,245.4 | 117,366.4 | 112,682.1 | 108,184.8 | 103,867.0 |
| Revenue Growth, % | 0 | -4.3 | -10.48 | -2.4 | 1.21 | -3.99 | -3.99 | -3.99 | -3.99 | -3.99 |
| EBITDA | 9,975.9 | -10,204.5 | 1,747.9 | 8,119.9 | 9,175.3 | 3,559.8 | 3,417.7 | 3,281.3 | 3,150.4 | 3,024.6 |
| EBITDA, % | 6.63 | -7.09 | 1.36 | 6.45 | 7.21 | 2.91 | 2.91 | 2.91 | 2.91 | 2.91 |
| Depreciation | 3,104.8 | 2,630.4 | 3,331.2 | 3,931.1 | 3,412.9 | 3,002.3 | 2,882.5 | 2,767.5 | 2,657.0 | 2,551.0 |
| Depreciation, % | 2.06 | 1.83 | 2.58 | 3.12 | 2.68 | 2.46 | 2.46 | 2.46 | 2.46 | 2.46 |
| EBIT | 6,871.1 | -12,834.9 | -1,583.3 | 4,188.8 | 5,762.3 | 557.5 | 535.2 | 513.8 | 493.3 | 473.7 |
| EBIT, % | 4.57 | -8.91 | -1.23 | 3.33 | 4.53 | 0.45602 | 0.45602 | 0.45602 | 0.45602 | 0.45602 |
| Total Cash | 34,664.9 | 36,123.0 | 37,262.4 | 55,066.3 | 44,217.6 | 38,026.9 | 36,509.2 | 35,052.0 | 33,653.0 | 32,309.9 |
| Total Cash, percent | .0 | .0 | .0 | .0 | .0 | .0 | .0 | .0 | .0 | .0 |
| Account Receivables | 92,511.7 | 84,462.0 | 109,968.1 | 76,143.1 | 106,568.8 | 85,494.2 | 82,082.0 | 78,806.0 | 75,660.7 | 72,641.0 |
| Account Receivables, % | 61.49 | 58.66 | 85.31 | 60.52 | 83.7 | 69.94 | 69.94 | 69.94 | 69.94 | 69.94 |
| Inventories | 32,861.4 | 36,032.3 | 33,832.2 | 35,532.8 | 37,862.8 | 32,051.4 | 30,772.1 | 29,544.0 | 28,364.8 | 27,232.7 |
| Inventories, % | 21.84 | 25.02 | 26.25 | 28.24 | 29.74 | 26.22 | 26.22 | 26.22 | 26.22 | 26.22 |
| Accounts Payable | 85,410.4 | 85,350.6 | 80,511.2 | 78,558.6 | 82,952.3 | 74,838.6 | 71,851.6 | 68,983.9 | 66,230.7 | 63,587.3 |
| Accounts Payable, % | 56.77 | 59.28 | 62.46 | 62.44 | 65.15 | 61.22 | 61.22 | 61.22 | 61.22 | 61.22 |
| Capital Expenditure | -7,023.5 | -4,722.1 | -4,433.0 | -4,634.0 | -4,825.5 | -4,611.1 | -4,427.1 | -4,250.4 | -4,080.8 | -3,917.9 |
| Capital Expenditure, % | -4.67 | -3.28 | -3.44 | -3.68 | -3.79 | -3.77 | -3.77 | -3.77 | -3.77 | -3.77 |
| Tax Rate, % | 79.88 | 79.88 | 79.88 | 79.88 | 79.88 | 79.88 | 79.88 | 79.88 | 79.88 | 79.88 |
| EBITAT | 5,701.3 | -12,773.1 | -1,853.9 | 362.5 | 1,159.5 | 347.0 | 333.2 | 319.9 | 307.1 | 294.9 |
| Depreciation | ||||||||||
| Changes in Account Receivables | ||||||||||
| Changes in Inventories | ||||||||||
| Changes in Accounts Payable | ||||||||||
| Capital Expenditure | ||||||||||
| UFCF | -38,180.1 | -10,045.8 | -31,101.3 | 29,831.5 | -28,615.0 | 17,510.5 | 493.1 | 473.4 | 454.5 | 436.4 |
| WACC, % | 3.95 | 4.41 | 4.42 | 1.9 | 2.22 | 3.38 | 3.38 | 3.38 | 3.38 | 3.38 |
| PV UFCF | ||||||||||
| SUM PV UFCF | 18,595.3 | |||||||||
| Long Term Growth Rate, % | 2.00 | |||||||||
| Free cash flow (T + 1) | 445 | |||||||||
| Terminal Value | 32,238 | |||||||||
| Present Terminal Value | 27,300 | |||||||||
| Enterprise Value | 45,895 | |||||||||
| Net Debt | 6,712 | |||||||||
| Equity Value | 39,183 | |||||||||
| Diluted Shares Outstanding, MM | 4,590 | |||||||||
| Equity Value Per Share | 8.54 |
What You Will Receive
- Pre-Filled Financial Model: Leverage Shanghai Electric Group's actual data for an accurate DCF valuation.
- Comprehensive Forecast Control: Modify revenue growth, profit margins, WACC, and other essential parameters.
- Real-Time Calculations: Automatic updates let you view results instantly as you make adjustments.
- Professional-Grade Template: A polished Excel file crafted for investor-ready valuation.
- Flexible and Reusable: Designed for adaptability, allowing for continuous use in detailed forecasting.
Key Features
- Genuine Shanghai Electric Financials: Gain access to precise pre-loaded historical data and future forecasts.
- Adjustable Forecast Assumptions: Modify the yellow-highlighted cells for WACC, growth rates, and margins as needed.
- Real-Time Calculations: Automatic refresh of DCF, Net Present Value (NPV), and cash flow analyses.
- User-Friendly Dashboard: Clear charts and summaries to help visualize your valuation outcomes.
- Designed for All Experience Levels: An intuitive format tailored for investors, CFOs, and consultants alike.
How It Works
- 1. Access the Template: Download and open the Excel file featuring Shanghai Electric Group Company Limited’s preloaded data.
- 2. Modify Assumptions: Adjust essential inputs such as growth rates, WACC, and capital expenditures.
- 3. View Results in Real-Time: The DCF model automatically calculates intrinsic value and NPV.
- 4. Experiment with Scenarios: Analyze different valuation outcomes by comparing multiple forecasts.
- 5. Present with Assurance: Share professional valuation insights to strengthen your decision-making.
Why Opt for This Calculator?
- All-in-One Solution: Combines DCF, WACC, and financial ratio assessments into a single platform.
- Flexible Inputs: Modify the yellow-highlighted fields to explore different scenarios.
- In-Depth Analysis: Automatically calculates the intrinsic value and Net Present Value for Shanghai Electric Group Company Limited (2727HK).
- Preloaded Information: Historical and projected data provide reliable starting points.
- Expert Level: Perfect for financial analysts, investors, and business consultants alike.
Who Should Utilize This Product?
- Individual Investors: Gain insights to make informed decisions about buying or selling Shanghai Electric Group Company Limited (2727HK) stock.
- Financial Analysts: Enhance valuation processes with comprehensive, ready-made financial models specific to Shanghai Electric Group (2727HK).
- Consultants: Provide quick and precise valuation insights regarding Shanghai Electric Group (2727HK) to clients.
- Business Owners: Learn how major corporations like Shanghai Electric Group (2727HK) are valued to inform your strategic planning.
- Finance Students: Master valuation techniques through the analysis of real-world data and case studies on Shanghai Electric Group (2727HK).
Contents of the Template
- Preloaded SEHK Data: Historical and projected financial metrics, including revenue, EBIT, and capital expenditures.
- DCF and WACC Models: Professional-grade templates designed to calculate intrinsic value and Weighted Average Cost of Capital.
- Editable Inputs: Yellow-highlighted cells available for modifying revenue growth, tax rates, and discount rates.
- Financial Statements: Detailed annual and quarterly financial reports for thorough analysis.
- Key Ratios: Metrics on profitability, leverage, and efficiency to assess performance.
- Dashboard and Charts: Visual representations of valuation results and underlying assumptions.
Disclaimer
All information, articles, and product details provided on this website are for general informational and educational purposes only. We do not claim any ownership over, nor do we intend to infringe upon, any trademarks, copyrights, logos, brand names, or other intellectual property mentioned or depicted on this site. Such intellectual property remains the property of its respective owners, and any references here are made solely for identification or informational purposes, without implying any affiliation, endorsement, or partnership.
We make no representations or warranties, express or implied, regarding the accuracy, completeness, or suitability of any content or products presented. Nothing on this website should be construed as legal, tax, investment, financial, medical, or other professional advice. In addition, no part of this site—including articles or product references—constitutes a solicitation, recommendation, endorsement, advertisement, or offer to buy or sell any securities, franchises, or other financial instruments, particularly in jurisdictions where such activity would be unlawful.
All content is of a general nature and may not address the specific circumstances of any individual or entity. It is not a substitute for professional advice or services. Any actions you take based on the information provided here are strictly at your own risk. You accept full responsibility for any decisions or outcomes arising from your use of this website and agree to release us from any liability in connection with your use of, or reliance upon, the content or products found herein.