
|
Kewpie Corporation (2809.t) DCF -Bewertung |
Fully Editable: Tailor To Your Needs In Excel Or Sheets
Professional Design: Trusted, Industry-Standard Templates
Investor-Approved Valuation Models
MAC/PC Compatible, Fully Unlocked
No Expertise Is Needed; Easy To Follow
Kewpie Corporation (2809.T) Bundle
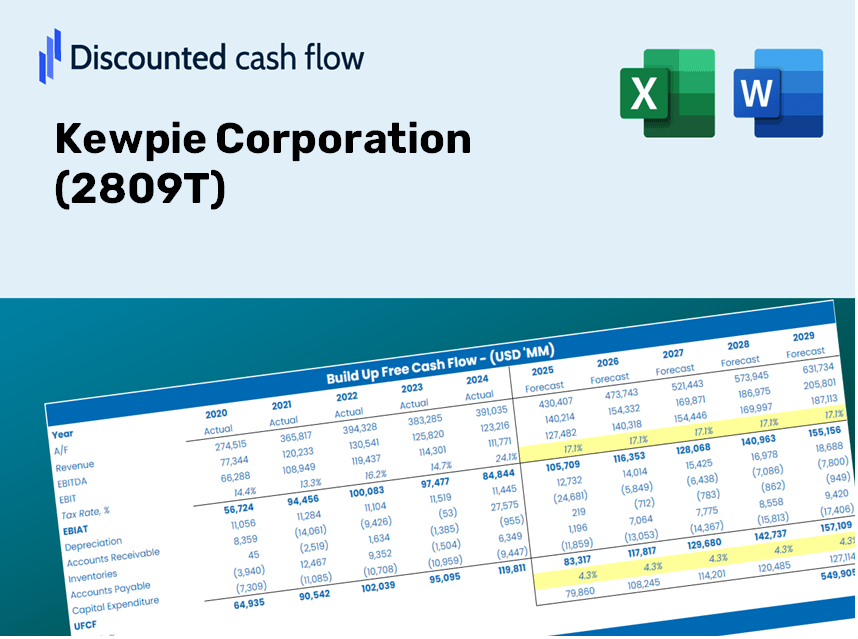
Gewinnen Sie einen Einblick in Ihre Bewertungsanalyse der Kewpie Corporation (2809T) mit unserem ausgefeilten DCF -Taschenrechner! Diese Excel -Vorlage mit authentischen (2809T) Daten vorinstalliert und ermöglicht es Ihnen, die Prognosen und Annahmen anzupassen, um den inneren Wert der KeWPie Corporation genau zu bestimmen.
Benefits You'll Receive
- Customizable Excel Template: An Excel-based DCF Calculator tailored for Kewpie Corporation (2809T) featuring pre-filled financial data.
- Authentic Data: Access to historical trends and projected estimates (indicated in the highlighted cells).
- Flexible Forecasting: Adjust key assumptions such as revenue growth, EBITDA margin, and WACC according to your analysis.
- Instant Calculations: Quickly observe how your adjustments affect the valuation of Kewpie Corporation (2809T).
- Professional Resource: Designed for investors, CFOs, consultants, and financial analysts seeking accurate insights.
- User-Centric Interface: Organized for straightforward navigation, complete with detailed instructions for ease of use.
Key Features
- Comprehensive DCF Calculator: Offers detailed unlevered and levered DCF valuation models for accurate assessments.
- WACC Calculator: Features a pre-constructed Weighted Average Cost of Capital sheet with adjustable inputs.
- Customizable Forecast Assumptions: Easily alter growth rates, capital expenditures, and discount rates to suit your analysis.
- Integrated Financial Ratios: Evaluate profitability, leverage, and efficiency ratios specific to Kewpie Corporation (2809T).
- Interactive Dashboard and Charts: Visual representations that condense key valuation metrics for straightforward analysis.
How It Functions
- 1. Access the Template: Download and open the Excel file containing Kewpie Corporation's (2809T) preloaded data.
- 2. Adjust Assumptions: Modify essential inputs such as growth rates, WACC, and capital expenditures.
- 3. View Instant Results: The DCF model automatically calculates intrinsic value and NPV in real-time.
- 4. Explore Scenarios: Analyze various forecasts to evaluate different valuation results.
- 5. Utilize with Assurance: Deliver professional valuation insights to enhance your decision-making process.
Why Select This Calculator for Kewpie Corporation (2809T)?
- Precise Data: Utilize authentic Kewpie financials for dependable valuation outcomes.
- Flexible: Modify essential parameters such as growth rates, WACC, and tax rates to align with your forecasts.
- Efficiency: Built-in calculations save you the hassle of starting from scratch.
- Professional-Quality Tool: Tailored for investors, analysts, and consultants focusing on Kewpie Corporation (2809T).
- Easy to Use: User-friendly interface and comprehensive instructions cater to all skill levels.
Who Should Utilize Kewpie Corporation's Services?
- Investors: Evaluate Kewpie's valuation prior to making stock transactions.
- CFOs and Financial Analysts: Optimize valuation workflows and assess financial forecasts.
- Startup Founders: Understand the valuation methods used for established companies like Kewpie (2809T).
- Consultants: Provide detailed valuation analyses for your clients.
- Students and Educators: Utilize authentic market data to enhance learning and application of valuation strategies.
Contents of the Template
- Pre-Filled Data: Contains Kewpie Corporation's historical financial data and projections.
- Discounted Cash Flow Model: An editable DCF valuation model equipped with automatic calculations.
- Weighted Average Cost of Capital (WACC): A specific sheet for WACC calculation based on user-defined inputs.
- Key Financial Ratios: Evaluate Kewpie's profitability, efficiency, and leverage metrics.
- Customizable Inputs: Effortlessly modify revenue growth rates, profit margins, and tax rates.
- Clear Dashboard: Visual representation of key valuation metrics through charts and tables.
Disclaimer
All information, articles, and product details provided on this website are for general informational and educational purposes only. We do not claim any ownership over, nor do we intend to infringe upon, any trademarks, copyrights, logos, brand names, or other intellectual property mentioned or depicted on this site. Such intellectual property remains the property of its respective owners, and any references here are made solely for identification or informational purposes, without implying any affiliation, endorsement, or partnership.
We make no representations or warranties, express or implied, regarding the accuracy, completeness, or suitability of any content or products presented. Nothing on this website should be construed as legal, tax, investment, financial, medical, or other professional advice. In addition, no part of this site—including articles or product references—constitutes a solicitation, recommendation, endorsement, advertisement, or offer to buy or sell any securities, franchises, or other financial instruments, particularly in jurisdictions where such activity would be unlawful.
All content is of a general nature and may not address the specific circumstances of any individual or entity. It is not a substitute for professional advice or services. Any actions you take based on the information provided here are strictly at your own risk. You accept full responsibility for any decisions or outcomes arising from your use of this website and agree to release us from any liability in connection with your use of, or reliance upon, the content or products found herein.