
|
Liaoning Port Co., Ltd. (2880.HK) DCF -Bewertung |
Fully Editable: Tailor To Your Needs In Excel Or Sheets
Professional Design: Trusted, Industry-Standard Templates
Investor-Approved Valuation Models
MAC/PC Compatible, Fully Unlocked
No Expertise Is Needed; Easy To Follow
Liaoning Port Co., Ltd. (2880.HK) Bundle
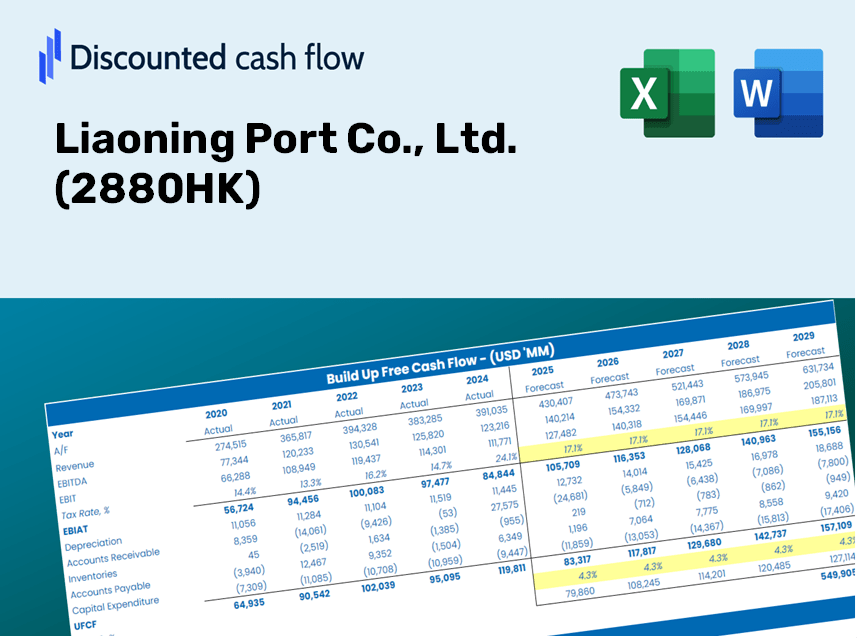
Gewinnen Sie Einblick in Ihre Liaoning Port Co., Ltd. (2880HK) Bewertungsanalyse mit unserem ausgefeilten DCF -Taschenrechner! Diese Excel-Vorlage mit Echtzeitdaten für (2880HK) ermöglicht es Ihnen, Prognosen und Annahmen anzupassen, um eine genaue Berechnung der intrinsischen Wert von Liaoning Port Co., Ltd., zu ermöglichen.
Discounted Cash Flow (DCF) - (USD MM)
| Year | AY1 2020 |
AY2 2021 |
AY3 2022 |
AY4 2023 |
AY5 2024 |
FY1 2025 |
FY2 2026 |
FY3 2027 |
FY4 2028 |
FY5 2029 |
|---|---|---|---|---|---|---|---|---|---|---|
| Revenue | 7,279.3 | 13,500.8 | 13,099.7 | 13,361.2 | 12,100.3 | 14,370.9 | 17,067.5 | 20,270.1 | 24,073.7 | 28,590.9 |
| Revenue Growth, % | 0 | 85.47 | -2.97 | 2 | -9.44 | 18.76 | 18.76 | 18.76 | 18.76 | 18.76 |
| EBITDA | 5,811.5 | 6,030.4 | 5,200.3 | 5,238.2 | 5,008.7 | 7,036.0 | 8,356.2 | 9,924.2 | 11,786.5 | 13,998.1 |
| EBITDA, % | 79.84 | 44.67 | 39.7 | 39.2 | 41.39 | 48.96 | 48.96 | 48.96 | 48.96 | 48.96 |
| Depreciation | 2,277.0 | 2,436.4 | 2,485.8 | 2,464.9 | 2,557.0 | 3,100.7 | 3,682.5 | 4,373.5 | 5,194.2 | 6,168.9 |
| Depreciation, % | 31.28 | 18.05 | 18.98 | 18.45 | 21.13 | 21.58 | 21.58 | 21.58 | 21.58 | 21.58 |
| EBIT | 3,534.6 | 3,594.0 | 2,714.6 | 2,773.3 | 2,451.7 | 3,935.3 | 4,673.7 | 5,550.7 | 6,592.2 | 7,829.2 |
| EBIT, % | 48.56 | 26.62 | 20.72 | 20.76 | 20.26 | 27.38 | 27.38 | 27.38 | 27.38 | 27.38 |
| Total Cash | 5,921.5 | 5,120.2 | 5,560.1 | 5,716.7 | 5,774.0 | 7,249.3 | 8,609.6 | 10,225.1 | 12,143.8 | 14,422.5 |
| Total Cash, percent | .0 | .0 | .0 | .0 | .0 | .0 | .0 | .0 | .0 | .0 |
| Account Receivables | 2,540.1 | 3,179.3 | 3,782.1 | 4,219.0 | 4,183.1 | 4,410.8 | 5,238.4 | 6,221.4 | 7,388.8 | 8,775.3 |
| Account Receivables, % | 34.9 | 23.55 | 28.87 | 31.58 | 34.57 | 30.69 | 30.69 | 30.69 | 30.69 | 30.69 |
| Inventories | 83.5 | 124.4 | 135.5 | 145.8 | 137.0 | 153.1 | 181.8 | 215.9 | 256.4 | 304.5 |
| Inventories, % | 1.15 | 0.92167 | 1.03 | 1.09 | 1.13 | 1.07 | 1.07 | 1.07 | 1.07 | 1.07 |
| Accounts Payable | 355.7 | 327.2 | 376.1 | 352.6 | 433.4 | 471.4 | 559.8 | 664.9 | 789.7 | 937.8 |
| Accounts Payable, % | 4.89 | 2.42 | 2.87 | 2.64 | 3.58 | 3.28 | 3.28 | 3.28 | 3.28 | 3.28 |
| Capital Expenditure | -290.7 | -4,181.5 | -3,754.6 | -729.9 | -697.5 | -2,151.4 | -2,555.1 | -3,034.6 | -3,604.0 | -4,280.3 |
| Capital Expenditure, % | -3.99 | -30.97 | -28.66 | -5.46 | -5.76 | -14.97 | -14.97 | -14.97 | -14.97 | -14.97 |
| Tax Rate, % | 36.27 | 36.27 | 36.27 | 36.27 | 36.27 | 36.27 | 36.27 | 36.27 | 36.27 | 36.27 |
| EBITAT | 2,344.2 | 2,594.3 | 1,889.4 | 1,830.4 | 1,562.5 | 2,659.0 | 3,157.9 | 3,750.5 | 4,454.3 | 5,290.1 |
| Depreciation | ||||||||||
| Changes in Account Receivables | ||||||||||
| Changes in Inventories | ||||||||||
| Changes in Accounts Payable | ||||||||||
| Capital Expenditure | ||||||||||
| UFCF | 2,062.6 | 140.5 | 55.7 | 3,094.8 | 3,547.4 | 3,402.6 | 3,517.4 | 4,177.4 | 4,961.3 | 5,892.3 |
| WACC, % | 5.4 | 5.44 | 5.42 | 5.39 | 5.38 | 5.41 | 5.41 | 5.41 | 5.41 | 5.41 |
| PV UFCF | ||||||||||
| SUM PV UFCF | 18,507.9 | |||||||||
| Long Term Growth Rate, % | 2.00 | |||||||||
| Free cash flow (T + 1) | 6,010 | |||||||||
| Terminal Value | 176,385 | |||||||||
| Present Terminal Value | 135,552 | |||||||||
| Enterprise Value | 154,060 | |||||||||
| Net Debt | 5,238 | |||||||||
| Equity Value | 148,822 | |||||||||
| Diluted Shares Outstanding, MM | 55,594 | |||||||||
| Equity Value Per Share | 2.68 |
What You Will Receive
- Comprehensive Financial Model: Utilize Liaoning Port Co., Ltd.'s [2880HK] real data for an accurate DCF valuation.
- Full Control Over Projections: Modify assumptions around revenue growth, profit margins, WACC, and other essential factors.
- Real-Time Calculations: Enjoy automatic updates that reflect changes immediately in your results.
- Professional-Grade Template: A polished Excel file crafted for advanced valuation needs.
- Adaptable and Reusable: Designed for versatility, allowing you to conduct in-depth forecasts repeatedly.
Key Features
- Pre-Loaded Data: Liaoning Port Co., Ltd.'s historical financial statements and pre-filled forecasts.
- Fully Adjustable Inputs: Customize WACC, tax rates, revenue growth, and EBITDA margins.
- Instant Results: View Liaoning Port Co., Ltd.'s intrinsic value recalculated in real time.
- Clear Visual Outputs: Dashboard charts illustrate valuation results and essential metrics.
- Built for Accuracy: A professional-grade tool designed for analysts, investors, and finance specialists.
How It Operates
- Download the Template: Obtain immediate access to the Excel-based LIAONING PORT DCF Calculator.
- Input Your Assumptions: Modify the yellow-highlighted cells for growth rates, WACC, profit margins, and additional variables.
- Instant Calculations: The model automatically recalculates the intrinsic value of Liaoning Port Co., Ltd. (2880HK).
- Test Scenarios: Explore various assumptions to assess their impact on valuation.
- Analyze and Decide: Utilize the findings to inform your investment strategies or financial assessments.
Why Opt for This Calculator?
- Designed for Experts: A sophisticated tool utilized by financial analysts, CFOs, and consultants.
- Authentic Data: Liaoning Port Co., Ltd.'s (2880HK) historical and projected financials are preloaded for precision.
- Flexible Scenario Analysis: Effortlessly simulate various forecasts and assumptions.
- Concise Outputs: Automatically computes intrinsic value, NPV, and essential metrics.
- User-Friendly: Step-by-step instructions lead you through the entire process.
Who Can Benefit from Liaoning Port Co., Ltd. (2880HK)?
- Investors: Enhance your investment strategy with a robust and reliable valuation tool.
- Financial Analysts: Streamline your work with a customizable DCF model that saves time.
- Consultants: Effortlessly tailor the template for client presentations and detailed reports.
- Finance Enthusiasts: Broaden your knowledge of valuation methods through practical, real-life examples.
- Educators and Students: Utilize this resource as a hands-on learning aid in finance-related studies.
Contents of the Template
- Operating and Balance Sheet Data: Pre-filled historical data and forecasts for Liaoning Port Co., Ltd. (2880HK), including metrics like revenue, EBITDA, EBIT, and capital expenditures.
- WACC Calculation: A dedicated sheet for calculating the Weighted Average Cost of Capital (WACC), featuring key parameters such as Beta, risk-free rate, and share price.
- DCF Valuation (Unlevered and Levered): Customizable Discounted Cash Flow models that illustrate intrinsic value with comprehensive calculations.
- Financial Statements: Pre-loaded financial statements (both annual and quarterly) that assist in thorough analysis.
- Key Ratios: A compilation of profitability, leverage, and efficiency ratios specific to Liaoning Port Co., Ltd. (2880HK).
- Dashboard and Charts: A visual representation of valuation outputs and assumptions for straightforward analysis of results.
Disclaimer
All information, articles, and product details provided on this website are for general informational and educational purposes only. We do not claim any ownership over, nor do we intend to infringe upon, any trademarks, copyrights, logos, brand names, or other intellectual property mentioned or depicted on this site. Such intellectual property remains the property of its respective owners, and any references here are made solely for identification or informational purposes, without implying any affiliation, endorsement, or partnership.
We make no representations or warranties, express or implied, regarding the accuracy, completeness, or suitability of any content or products presented. Nothing on this website should be construed as legal, tax, investment, financial, medical, or other professional advice. In addition, no part of this site—including articles or product references—constitutes a solicitation, recommendation, endorsement, advertisement, or offer to buy or sell any securities, franchises, or other financial instruments, particularly in jurisdictions where such activity would be unlawful.
All content is of a general nature and may not address the specific circumstances of any individual or entity. It is not a substitute for professional advice or services. Any actions you take based on the information provided here are strictly at your own risk. You accept full responsibility for any decisions or outcomes arising from your use of this website and agree to release us from any liability in connection with your use of, or reliance upon, the content or products found herein.