
|
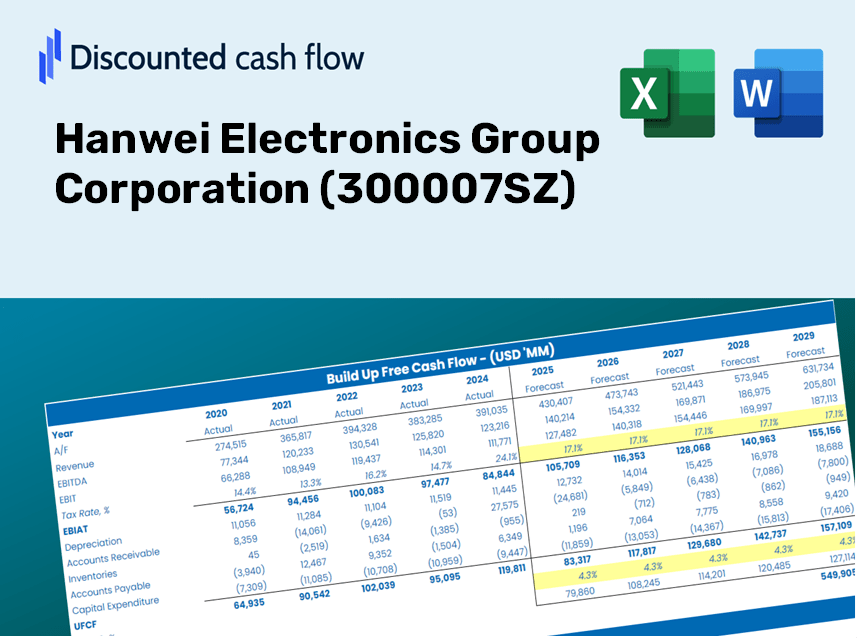
Hanwei Electronics Group Corporation (300007.SZ) DCF -Bewertung |
Fully Editable: Tailor To Your Needs In Excel Or Sheets
Professional Design: Trusted, Industry-Standard Templates
Investor-Approved Valuation Models
MAC/PC Compatible, Fully Unlocked
No Expertise Is Needed; Easy To Follow
Hanwei Electronics Group Corporation (300007.SZ) Bundle
Optimieren Sie Ihre Zeit und verbessern Sie die Präzision mit unserem DCF -Taschenrechner (300007SZ)! Mit realen Daten der Hanwei Electronics Group Corporation und anpassbaren Annahmen ermöglichen dieses Tool Sie, wie ein erfahrener Investor prognostiziert, analysieren und bewerten (300007SZ).
Discounted Cash Flow (DCF) - (USD MM)
| Year | AY1 2020 |
AY2 2021 |
AY3 2022 |
AY4 2023 |
AY5 2024 |
FY1 2025 |
FY2 2026 |
FY3 2027 |
FY4 2028 |
FY5 2029 |
|---|---|---|---|---|---|---|---|---|---|---|
| Revenue | 1,941.2 | 2,316.2 | 2,395.1 | 2,287.2 | 2,227.6 | 2,314.6 | 2,404.9 | 2,498.8 | 2,596.4 | 2,697.8 |
| Revenue Growth, % | 0 | 19.32 | 3.4 | -4.5 | -2.61 | 3.9 | 3.9 | 3.9 | 3.9 | 3.9 |
| EBITDA | 332.2 | 443.5 | 408.2 | 241.8 | 161.6 | 329.3 | 342.1 | 355.5 | 369.3 | 383.8 |
| EBITDA, % | 17.11 | 19.15 | 17.04 | 10.57 | 7.25 | 14.23 | 14.23 | 14.23 | 14.23 | 14.23 |
| Depreciation | 140.1 | 174.6 | 194.4 | 165.2 | 178.0 | 176.3 | 183.2 | 190.3 | 197.8 | 205.5 |
| Depreciation, % | 7.22 | 7.54 | 8.12 | 7.22 | 7.99 | 7.62 | 7.62 | 7.62 | 7.62 | 7.62 |
| EBIT | 192.1 | 268.9 | 213.7 | 76.6 | -16.4 | 153.0 | 158.9 | 165.1 | 171.6 | 178.3 |
| EBIT, % | 9.89 | 11.61 | 8.92 | 3.35 | -0.7365 | 6.61 | 6.61 | 6.61 | 6.61 | 6.61 |
| Total Cash | 1,347.2 | 1,450.5 | 1,280.7 | 1,293.0 | 771.8 | 1,280.8 | 1,330.8 | 1,382.7 | 1,436.7 | 1,492.8 |
| Total Cash, percent | .0 | .0 | .0 | .0 | .0 | .0 | .0 | .0 | .0 | .0 |
| Account Receivables | 749.9 | 1,085.4 | 1,104.8 | 1,495.9 | 1,606.1 | 1,245.8 | 1,294.5 | 1,345.0 | 1,397.5 | 1,452.1 |
| Account Receivables, % | 38.63 | 46.86 | 46.13 | 65.4 | 72.1 | 53.82 | 53.82 | 53.82 | 53.82 | 53.82 |
| Inventories | 227.5 | 345.2 | 456.3 | 414.8 | 470.4 | 393.2 | 408.5 | 424.5 | 441.0 | 458.2 |
| Inventories, % | 11.72 | 14.9 | 19.05 | 18.14 | 21.12 | 16.99 | 16.99 | 16.99 | 16.99 | 16.99 |
| Accounts Payable | 510.1 | 664.7 | 734.9 | 744.7 | 553.3 | 662.2 | 688.1 | 715.0 | 742.9 | 771.9 |
| Accounts Payable, % | 26.28 | 28.7 | 30.68 | 32.56 | 24.84 | 28.61 | 28.61 | 28.61 | 28.61 | 28.61 |
| Capital Expenditure | -376.8 | -244.6 | -195.1 | -222.7 | -148.8 | -252.4 | -262.3 | -272.5 | -283.2 | -294.2 |
| Capital Expenditure, % | -19.41 | -10.56 | -8.15 | -9.74 | -6.68 | -10.91 | -10.91 | -10.91 | -10.91 | -10.91 |
| Tax Rate, % | -3.43 | -3.43 | -3.43 | -3.43 | -3.43 | -3.43 | -3.43 | -3.43 | -3.43 | -3.43 |
| EBITAT | 138.1 | 185.0 | 179.7 | 63.5 | -17.0 | 124.7 | 129.6 | 134.6 | 139.9 | 145.4 |
| Depreciation | ||||||||||
| Changes in Account Receivables | ||||||||||
| Changes in Inventories | ||||||||||
| Changes in Accounts Payable | ||||||||||
| Capital Expenditure | ||||||||||
| UFCF | -565.8 | -183.6 | 118.6 | -333.8 | -344.8 | 595.0 | 12.3 | 12.8 | 13.3 | 13.8 |
| WACC, % | 4.67 | 4.67 | 4.7 | 4.69 | 4.73 | 4.69 | 4.69 | 4.69 | 4.69 | 4.69 |
| PV UFCF | ||||||||||
| SUM PV UFCF | 612.9 | |||||||||
| Long Term Growth Rate, % | 3.00 | |||||||||
| Free cash flow (T + 1) | 14 | |||||||||
| Terminal Value | 843 | |||||||||
| Present Terminal Value | 670 | |||||||||
| Enterprise Value | 1,283 | |||||||||
| Net Debt | -30 | |||||||||
| Equity Value | 1,313 | |||||||||
| Diluted Shares Outstanding, MM | 327 | |||||||||
| Equity Value Per Share | 4.01 |
What You Will Receive
- Customizable Excel Template: An adaptable Excel DCF Calculator featuring pre-filled financial data for Hanwei Electronics Group Corporation (300007SZ).
- Actual Financial Data: Access to historical performance metrics and future projections (highlighted in the yellow cells).
- Adjustable Forecasting: Modify key assumptions such as revenue growth, EBITDA margin, and WACC.
- Instant Calculations: Quickly observe how your inputs affect the valuation of Hanwei Electronics Group Corporation (300007SZ).
- Professional Resource: Designed for investors, CFOs, consultants, and financial analysts.
- Intuitive Layout: Organized for simplicity and ease of navigation, complete with step-by-step guidance.
Key Features
- Pre-Loaded Data: Hanwei's historical financial statements and pre-filled forecasts.
- Fully Adjustable Inputs: Customize WACC, tax rates, revenue growth, and EBITDA margins.
- Instant Results: Observe Hanwei's intrinsic value recalculating in real time.
- Clear Visual Outputs: Dashboard charts present valuation results and key metrics.
- Built for Accuracy: A professional tool designed for analysts, investors, and finance experts.
How It Functions
- Download: Access the pre-formatted Excel file featuring Hanwei Electronics Group Corporation's financial data.
- Customize: Modify projections, including revenue growth, EBITDA percentage, and WACC.
- Update Automatically: The intrinsic value and NPV calculations refresh in real time.
- Test Scenarios: Generate various projections and instantly compare results.
- Make Decisions: Leverage the valuation outcomes to inform your investment strategy for Hanwei Electronics Group Corporation (300007SZ).
Why Select This Calculator for Hanwei Electronics Group Corporation (300007SZ)?
- All-in-One Tool: Combines DCF, WACC, and financial ratio analyses for a comprehensive evaluation.
- Flexible Inputs: Modify the yellow-highlighted cells to explore diverse financial scenarios.
- In-Depth Analysis: Automatically computes the intrinsic value and Net Present Value for Hanwei Electronics.
- Preloaded Information: Use historical and projected data to ensure reliable initial assessments.
- High Standard: Perfect for financial analysts, investors, and business advisors focused on Hanwei Electronics.
Who Is This Product For?
- Professional Investors: Create comprehensive and dependable valuation models for portfolio assessment of Hanwei Electronics Group Corporation (300007SZ).
- Corporate Finance Teams: Evaluate valuation scenarios to steer internal strategic decisions regarding Hanwei Electronics Group Corporation (300007SZ).
- Consultants and Advisors: Equip clients with precise valuation insights for Hanwei Electronics Group Corporation (300007SZ).
- Students and Educators: Leverage real-world data to practice and teach financial modeling with regards to Hanwei Electronics Group Corporation (300007SZ).
- Tech Enthusiasts: Gain insights into how technology companies like Hanwei Electronics Group Corporation (300007SZ) are valued within the market.
Contents of the Template
- Preloaded Hanwei Electronics Data: Historical and forecasted financial metrics, including revenue, EBIT, and capital expenditures.
- DCF and WACC Models: Advanced spreadsheets for determining intrinsic value and Weighted Average Cost of Capital.
- Editable Inputs: Cells highlighted in yellow for customizing revenue growth, tax rates, and discount rates.
- Financial Statements: Detailed annual and quarterly financial statements for thorough analysis.
- Key Ratios: Metrics on profitability, leverage, and efficiency to assess company performance.
- Dashboard and Charts: Visual representations of valuation results and underlying assumptions.
Disclaimer
All information, articles, and product details provided on this website are for general informational and educational purposes only. We do not claim any ownership over, nor do we intend to infringe upon, any trademarks, copyrights, logos, brand names, or other intellectual property mentioned or depicted on this site. Such intellectual property remains the property of its respective owners, and any references here are made solely for identification or informational purposes, without implying any affiliation, endorsement, or partnership.
We make no representations or warranties, express or implied, regarding the accuracy, completeness, or suitability of any content or products presented. Nothing on this website should be construed as legal, tax, investment, financial, medical, or other professional advice. In addition, no part of this site—including articles or product references—constitutes a solicitation, recommendation, endorsement, advertisement, or offer to buy or sell any securities, franchises, or other financial instruments, particularly in jurisdictions where such activity would be unlawful.
All content is of a general nature and may not address the specific circumstances of any individual or entity. It is not a substitute for professional advice or services. Any actions you take based on the information provided here are strictly at your own risk. You accept full responsibility for any decisions or outcomes arising from your use of this website and agree to release us from any liability in connection with your use of, or reliance upon, the content or products found herein.