
|
Shenzhen Tianyuan DIC Information Technology Co., Ltd. (300047.SZ) DCF -Bewertung |
Fully Editable: Tailor To Your Needs In Excel Or Sheets
Professional Design: Trusted, Industry-Standard Templates
Investor-Approved Valuation Models
MAC/PC Compatible, Fully Unlocked
No Expertise Is Needed; Easy To Follow
Shenzhen Tianyuan DIC Information Technology Co., Ltd. (300047.SZ) Bundle
Bewerten Sie die finanziellen Aussichten von Shenzhen Tianyuan DiC Information Technology Co., Ltd. wie ein Experte! Dieser DCF-Taschenrechner (300047SZ) bietet Ihnen vorgefüllte Finanzdaten und die Freiheit, das Umsatzwachstum, die WACC, die Margen und die anderen wichtigen Annahmen zu ändern, um sich an Ihren Projektionen anzupassen.
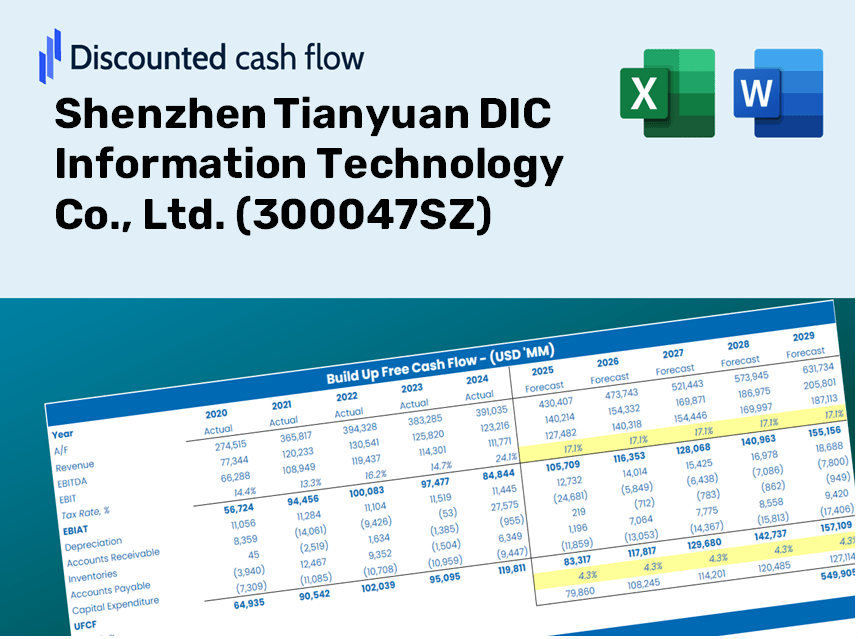
Discounted Cash Flow (DCF) - (USD MM)
| Year | AY1 2020 |
AY2 2021 |
AY3 2022 |
AY4 2023 |
AY5 2024 |
FY1 2025 |
FY2 2026 |
FY3 2027 |
FY4 2028 |
FY5 2029 |
|---|---|---|---|---|---|---|---|---|---|---|
| Revenue | 5,254.2 | 5,614.2 | 5,692.5 | 6,586.9 | 8,157.5 | 9,132.4 | 10,223.8 | 11,445.6 | 12,813.4 | 14,344.7 |
| Revenue Growth, % | 0 | 6.85 | 1.39 | 15.71 | 23.84 | 11.95 | 11.95 | 11.95 | 11.95 | 11.95 |
| EBITDA | 405.7 | 365.1 | 294.8 | 277.9 | 330.7 | 505.5 | 565.9 | 633.6 | 709.3 | 794.0 |
| EBITDA, % | 7.72 | 6.5 | 5.18 | 4.22 | 4.05 | 5.54 | 5.54 | 5.54 | 5.54 | 5.54 |
| Depreciation | 135.0 | 187.0 | 128.8 | 107.9 | 161.1 | 215.1 | 240.8 | 269.6 | 301.8 | 337.8 |
| Depreciation, % | 2.57 | 3.33 | 2.26 | 1.64 | 1.97 | 2.36 | 2.36 | 2.36 | 2.36 | 2.36 |
| EBIT | 270.7 | 178.1 | 166.0 | 170.1 | 169.6 | 290.4 | 325.1 | 364.0 | 407.5 | 456.2 |
| EBIT, % | 5.15 | 3.17 | 2.92 | 2.58 | 2.08 | 3.18 | 3.18 | 3.18 | 3.18 | 3.18 |
| Total Cash | 370.1 | 369.2 | 185.4 | 298.0 | 699.0 | 547.4 | 612.8 | 686.1 | 768.1 | 859.9 |
| Total Cash, percent | .0 | .0 | .0 | .0 | .0 | .0 | .0 | .0 | .0 | .0 |
| Account Receivables | 1,871.0 | 1,900.0 | 2,075.5 | 1,924.6 | 2,132.2 | 2,945.5 | 3,297.5 | 3,691.6 | 4,132.8 | 4,626.7 |
| Account Receivables, % | 35.61 | 33.84 | 36.46 | 29.22 | 26.14 | 32.25 | 32.25 | 32.25 | 32.25 | 32.25 |
| Inventories | 1,741.9 | 1,654.8 | 1,875.0 | 2,399.7 | 2,359.2 | 2,939.1 | 3,290.4 | 3,683.6 | 4,123.8 | 4,616.7 |
| Inventories, % | 33.15 | 29.48 | 32.94 | 36.43 | 28.92 | 32.18 | 32.18 | 32.18 | 32.18 | 32.18 |
| Accounts Payable | 118.9 | 157.4 | 106.3 | 102.8 | 112.1 | 180.3 | 201.8 | 226.0 | 253.0 | 283.2 |
| Accounts Payable, % | 2.26 | 2.8 | 1.87 | 1.56 | 1.37 | 1.97 | 1.97 | 1.97 | 1.97 | 1.97 |
| Capital Expenditure | -151.9 | -165.5 | -171.5 | -191.6 | -198.0 | -259.2 | -290.1 | -324.8 | -363.6 | -407.1 |
| Capital Expenditure, % | -2.89 | -2.95 | -3.01 | -2.91 | -2.43 | -2.84 | -2.84 | -2.84 | -2.84 | -2.84 |
| Tax Rate, % | 75.72 | 75.72 | 75.72 | 75.72 | 75.72 | 75.72 | 75.72 | 75.72 | 75.72 | 75.72 |
| EBITAT | 170.8 | 141.0 | 128.6 | 46.0 | 41.2 | 157.5 | 176.3 | 197.3 | 220.9 | 247.3 |
| Depreciation | ||||||||||
| Changes in Account Receivables | ||||||||||
| Changes in Inventories | ||||||||||
| Changes in Accounts Payable | ||||||||||
| Capital Expenditure | ||||||||||
| UFCF | -3,340.0 | 258.9 | -360.7 | -415.1 | -153.5 | -1,211.8 | -554.8 | -621.1 | -695.3 | -778.4 |
| WACC, % | 4.94 | 5.08 | 5.07 | 4.62 | 4.6 | 4.86 | 4.86 | 4.86 | 4.86 | 4.86 |
| PV UFCF | ||||||||||
| SUM PV UFCF | -3,387.8 | |||||||||
| Long Term Growth Rate, % | 3.50 | |||||||||
| Free cash flow (T + 1) | -806 | |||||||||
| Terminal Value | -59,189 | |||||||||
| Present Terminal Value | -46,684 | |||||||||
| Enterprise Value | -50,071 | |||||||||
| Net Debt | 2,524 | |||||||||
| Equity Value | -52,595 | |||||||||
| Diluted Shares Outstanding, MM | 637 | |||||||||
| Equity Value Per Share | -82.51 |
Benefits You Will Receive
- Authentic DIC Data: Comprehensive financials – spanning revenue to EBIT – derived from actual and forecasted data.
- Complete Customization: Modify all essential parameters (yellow cells) such as WACC, growth %, and tax rates to suit your analysis.
- Real-Time Valuation Adjustments: Automatic recalculations to evaluate how changes affect the fair value of Shenzhen Tianyuan DIC Information Technology Co., Ltd. (300047SZ).
- Flexible Excel Template: Designed for easy modifications, scenario analyses, and detailed financial forecasting.
- Efficient and Precise: Avoid starting models from scratch while ensuring accuracy and adaptability.
Key Features
- 🔍 Real-Life 300047SZ Financials: Pre-filled historical and projected data for Shenzhen Tianyuan DIC Information Technology Co., Ltd.
- ✏️ Fully Customizable Inputs: Modify all essential parameters (yellow cells) such as WACC, growth %, and tax rates.
- 📊 Professional DCF Valuation: Integrated formulas compute the intrinsic value of Shenzhen Tianyuan DIC using the Discounted Cash Flow method.
- ⚡ Instant Results: View Shenzhen Tianyuan's valuation immediately after adjustments.
- Scenario Analysis: Evaluate and compare results for different financial assumptions side-by-side.
How It Operates
- Step 1: Download the Excel spreadsheet.
- Step 2: Examine the pre-populated data for Shenzhen Tianyuan DIC Information Technology Co., Ltd. (300047SZ).
- Step 3: Modify the key assumptions (highlighted in yellow) according to your analysis.
- Step 4: Observe the automatic recalculations reflecting the intrinsic value for Shenzhen Tianyuan DIC Information Technology Co., Ltd. (300047SZ).
- Step 5: Utilize the results for making investment decisions or for reporting purposes.
Why Opt for This Calculator?
- Precise Information: Real financial data from Shenzhen Tianyuan DIC Information Technology Co., Ltd. (300047SZ) ensures trustworthy valuation outcomes.
- Flexible Options: Tailor key inputs such as growth rates, WACC, and tax rates to align with your projections.
- Efficiency Boost: Pre-configured calculations save you the hassle of starting from the ground up.
- Expert-Level Tool: Crafted for investors, analysts, and consultants in the field.
- Easy to Use: A user-friendly design along with step-by-step guidance makes it accessible for everyone.
Who Can Benefit from This Product?
- Investors: Assess the valuation of Shenzhen Tianyuan DIC Information Technology Co., Ltd. (300047SZ) prior to making investment decisions.
- CFOs and Financial Analysts: Enhance valuation methodologies and evaluate financial projections.
- Startup Founders: Gain insights into the valuation processes of established tech companies like Shenzhen Tianyuan DIC (300047SZ).
- Consultants: Provide comprehensive valuation reports for your client base.
- Students and Educators: Utilize actual market data to learn and teach valuation strategies.
Contents of the Template
- Historical Data: Contains past financial performance and baseline forecasts for Shenzhen Tianyuan DIC Information Technology Co., Ltd. (300047SZ).
- DCF and Levered DCF Models: Comprehensive templates designed to assess the intrinsic value of Shenzhen Tianyuan DIC Information Technology Co., Ltd. (300047SZ).
- WACC Sheet: Pre-calculated data for the Weighted Average Cost of Capital specific to Shenzhen Tianyuan DIC Information Technology Co., Ltd. (300047SZ).
- Editable Inputs: Customize essential variables such as growth rates, EBITDA percentages, and CAPEX assumptions.
- Quarterly and Annual Statements: Detailed analysis of the financials for Shenzhen Tianyuan DIC Information Technology Co., Ltd. (300047SZ).
- Interactive Dashboard: Dynamically visualize valuation results and forecasts.
Disclaimer
All information, articles, and product details provided on this website are for general informational and educational purposes only. We do not claim any ownership over, nor do we intend to infringe upon, any trademarks, copyrights, logos, brand names, or other intellectual property mentioned or depicted on this site. Such intellectual property remains the property of its respective owners, and any references here are made solely for identification or informational purposes, without implying any affiliation, endorsement, or partnership.
We make no representations or warranties, express or implied, regarding the accuracy, completeness, or suitability of any content or products presented. Nothing on this website should be construed as legal, tax, investment, financial, medical, or other professional advice. In addition, no part of this site—including articles or product references—constitutes a solicitation, recommendation, endorsement, advertisement, or offer to buy or sell any securities, franchises, or other financial instruments, particularly in jurisdictions where such activity would be unlawful.
All content is of a general nature and may not address the specific circumstances of any individual or entity. It is not a substitute for professional advice or services. Any actions you take based on the information provided here are strictly at your own risk. You accept full responsibility for any decisions or outcomes arising from your use of this website and agree to release us from any liability in connection with your use of, or reliance upon, the content or products found herein.