
|
Shenzhen Zqgame Co., Ltd (300052.Sz) DCF -Bewertung |
Fully Editable: Tailor To Your Needs In Excel Or Sheets
Professional Design: Trusted, Industry-Standard Templates
Investor-Approved Valuation Models
MAC/PC Compatible, Fully Unlocked
No Expertise Is Needed; Easy To Follow
Shenzhen Zqgame Co., Ltd (300052.SZ) Bundle
Optimieren Sie Ihre Analyse und verbessern Sie die Präzision mit unserem DCF -Taschenrechner (300052SZ)! Mit realen Daten von Shenzhen ZqGame Co., Ltd und anpassbaren Annahmen ermöglichen dieses Tool Sie, wie ein erfahrener Investor prognostiziert, bewertet und bewertet (300052SZ).
What You Will Receive
- Pre-Filled Financial Model: Utilize Shenzhen Zqgame Co., Ltd's actual data for accurate DCF valuation.
- Comprehensive Forecast Control: Adjust key drivers such as revenue growth, profit margins, and WACC to suit your analysis.
- Real-Time Calculations: Automatic updates provide immediate results as you tweak variables.
- Professional-Grade Template: A polished Excel file specifically designed for robust valuation processes.
- Flexible and Reusable: Custom-built for adaptability, allowing for ongoing detailed forecasting.
Key Features
- Customizable Forecast Inputs: Adjust essential metrics such as revenue growth, EBITDA margin, and capital expenditures.
- Instant DCF Valuation: Quickly computes intrinsic value, NPV, and other financial outputs.
- Precision at a Professional Level: Leverages Shenzhen Zqgame Co., Ltd's (300052SZ) actual financial data for accurate valuation results.
- Effortless Scenario Analysis: Easily explore various assumptions and compare results without hassle.
- Efficiency Booster: Remove the need to create intricate valuation models from the ground up.
How It Functions
- Download the Template: Gain immediate access to the Excel-based Zqgame DCF Calculator for Shenzhen Zqgame Co., Ltd (300052SZ).
- Input Your Assumptions: Modify the yellow-highlighted cells for growth rates, WACC, profit margins, and additional factors.
- Instant Calculations: The model automatically recalculates Shenzhen Zqgame's intrinsic value based on your inputs.
- Test Scenarios: Experiment with various assumptions to assess changes in potential valuation.
- Analyze and Decide: Utilize the outcomes to inform your investment strategy or financial evaluation.
Why Choose This Calculator for Shenzhen Zqgame Co., Ltd (300052SZ)?
- Precise Data: Up-to-date financial metrics from Zqgame provide trustworthy valuation insights.
- Tailor-Made: Modify essential variables such as growth rates, WACC, and tax rates to align with your forecasts.
- Efficiency: Built-in calculations save you the hassle of starting from ground zero.
- Expert-Level Tool: Crafted for investors, analysts, and consultants in the gaming industry.
- Easy to Use: Clear design and step-by-step guidance ensure accessibility for all users.
Who Should Use This Product?
- Professional Investors: Develop comprehensive and accurate valuation models for investment analysis of Shenzhen Zqgame Co., Ltd (300052SZ).
- Corporate Finance Teams: Evaluate valuation scenarios to shape internal strategies for Shenzhen Zqgame Co., Ltd (300052SZ).
- Consultants and Advisors: Offer clients precise valuation insights regarding Shenzhen Zqgame Co., Ltd (300052SZ).
- Students and Educators: Utilize real-world data to enhance financial modeling skills and education with respect to Shenzhen Zqgame Co., Ltd (300052SZ).
- Tech Enthusiasts: Gain insights into the valuation processes of tech companies like Shenzhen Zqgame Co., Ltd (300052SZ).
Contents of the Template
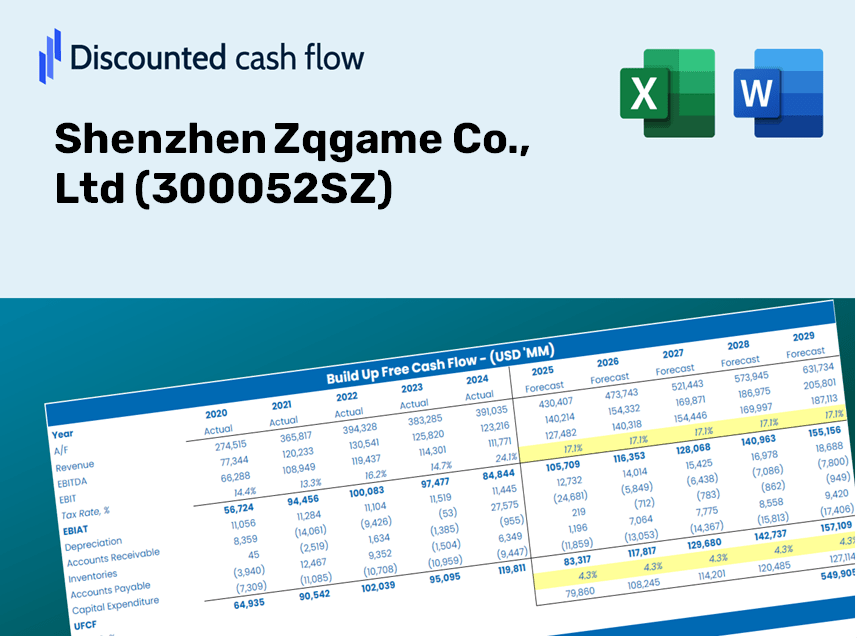
- Operating and Balance Sheet Data: Pre-populated historical data and forecasts for Shenzhen Zqgame Co., Ltd (300052SZ), including revenue, EBITDA, EBIT, and capital expenditures.
- WACC Calculation: A specific sheet for calculating the Weighted Average Cost of Capital (WACC), featuring parameters such as Beta, risk-free rate, and share price.
- DCF Valuation (Unlevered and Levered): Customizable Discounted Cash Flow models that display intrinsic value along with comprehensive calculations.
- Financial Statements: Pre-installed financial statements (both annual and quarterly) to aid in analysis.
- Key Ratios: Presentation of profitability, leverage, and efficiency ratios for Shenzhen Zqgame Co., Ltd (300052SZ).
- Dashboard and Charts: A visual overview of valuation outputs and assumptions for simplified results analysis.
Disclaimer
All information, articles, and product details provided on this website are for general informational and educational purposes only. We do not claim any ownership over, nor do we intend to infringe upon, any trademarks, copyrights, logos, brand names, or other intellectual property mentioned or depicted on this site. Such intellectual property remains the property of its respective owners, and any references here are made solely for identification or informational purposes, without implying any affiliation, endorsement, or partnership.
We make no representations or warranties, express or implied, regarding the accuracy, completeness, or suitability of any content or products presented. Nothing on this website should be construed as legal, tax, investment, financial, medical, or other professional advice. In addition, no part of this site—including articles or product references—constitutes a solicitation, recommendation, endorsement, advertisement, or offer to buy or sell any securities, franchises, or other financial instruments, particularly in jurisdictions where such activity would be unlawful.
All content is of a general nature and may not address the specific circumstances of any individual or entity. It is not a substitute for professional advice or services. Any actions you take based on the information provided here are strictly at your own risk. You accept full responsibility for any decisions or outcomes arising from your use of this website and agree to release us from any liability in connection with your use of, or reliance upon, the content or products found herein.