
|
Peking Haixin Energy Technology Co., Ltd. (300072.Sz) DCF -Bewertung |
Fully Editable: Tailor To Your Needs In Excel Or Sheets
Professional Design: Trusted, Industry-Standard Templates
Investor-Approved Valuation Models
MAC/PC Compatible, Fully Unlocked
No Expertise Is Needed; Easy To Follow
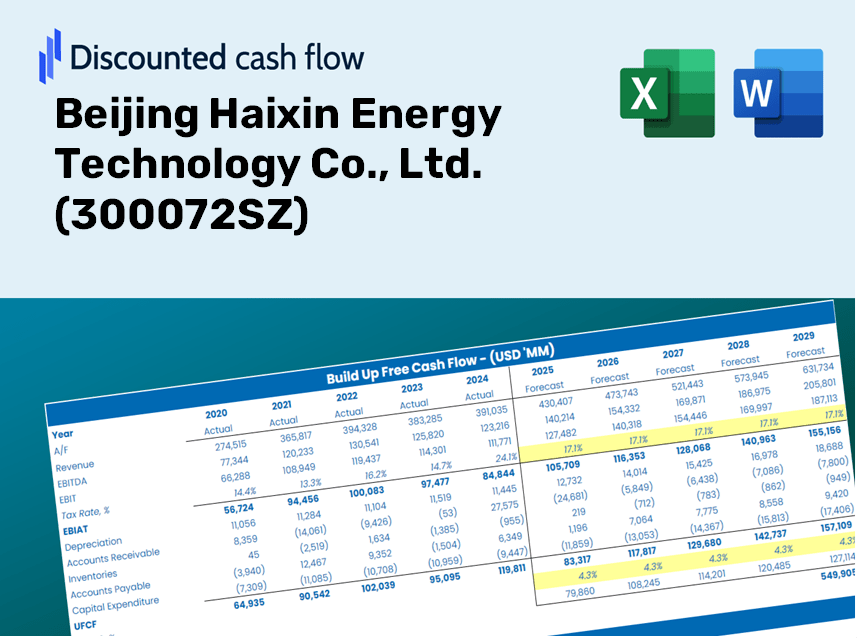
Beijing Haixin Energy Technology Co., Ltd. (300072.SZ) Bundle
Bewerten Sie die finanziellen Aussichten von Peking Haixin Energy Technology Co., Ltd. wie ein Experte! Dieser (300072SZ) DCF-Taschenrechner liefert vorgefüllte Finanzdaten sowie die Flexibilität, das Umsatzwachstum, die WACC, die Margen und die anderen entscheidenden Annahmen zu ändern, um sich an Ihren Projektionen anzupassen.
What You Will Gain
- Authentic 300072SZ Financial Data: Access both historical and projected figures for precise valuation.
- Customizable Inputs: Adjust variables like WACC, tax rates, growth in revenue, and capital expenditures.
- Automated Calculations: Intrinsic value and NPV are computed in real-time.
- Scenario Testing: Assess various scenarios to analyze the future performance of Beijing Haixin Energy Technology Co., Ltd.
- User-Friendly Design: Crafted for experts but easy enough for newcomers to navigate.
Key Features
- Comprehensive Real-Time Data: Pre-loaded with Beijing Haixin Energy Technology Co., Ltd.'s historical financial performance and future projections.
- Customizable Input Options: Tailor revenue growth rates, margins, WACC, tax rates, and capital expenditures to fit your analysis needs.
- Adaptive Valuation Model: Automatically refreshes Net Present Value (NPV) and intrinsic value based on your customized inputs.
- Multiple Scenario Analysis: Develop diverse forecasting scenarios to evaluate various valuation results.
- Intuitive User Interface: Designed for ease of use, catering to both professionals and newcomers.
How It Works
- Download: Obtain the pre-prepared Excel file containing Beijing Haixin Energy Technology Co., Ltd.’s (300072SZ) financial data.
- Customize: Modify forecasts such as revenue growth, EBITDA %, and WACC as needed.
- Update Automatically: Experience real-time updates to intrinsic value and NPV calculations.
- Test Scenarios: Generate various projections and instantly compare the results.
- Make Decisions: Leverage the valuation outcomes to inform your investment strategy.
Why Opt for This Calculator?
- All-in-One Solution: Integrates DCF, WACC, and financial ratio assessments seamlessly.
- Tailored Inputs: Modify the yellow-highlighted fields to explore different market scenarios.
- In-Depth Analysis: Automatically computes the intrinsic value and Net Present Value for Beijing Haixin Energy Technology Co., Ltd. (300072SZ).
- Loaded with Data: Incorporates historical and projected data for reliable analysis.
- Top-Notch Quality: Perfect for financial analysts, investors, and business consultants seeking precision.
Who Can Benefit from This Product?
- Investors: Accurately evaluate Beijing Haixin Energy Technology Co., Ltd.’s fair value (300072SZ) before making investment choices.
- CFOs: Utilize a professional-grade DCF model for comprehensive financial reporting and analysis.
- Consultants: Seamlessly customize the template for client valuation reports.
- Entrepreneurs: Acquire insights into the financial modeling practices of leading companies.
- Educators: Employ it as a teaching resource to illustrate various valuation techniques.
Contents of the Template
- Pre-Filled DCF Model: Financial data for Beijing Haixin Energy Technology Co., Ltd. (300072SZ) preloaded for immediate application.
- WACC Calculator: Comprehensive calculations for the Weighted Average Cost of Capital.
- Financial Ratios: Assess Beijing Haixin's profitability, leverage, and operational efficiency.
- Editable Inputs: Modify assumptions such as growth rates, profit margins, and capital expenditures to suit your scenarios.
- Financial Statements: Access to annual and quarterly reports for in-depth analysis.
- Interactive Dashboard: Effortlessly visualize essential valuation metrics and outcomes.
Disclaimer
All information, articles, and product details provided on this website are for general informational and educational purposes only. We do not claim any ownership over, nor do we intend to infringe upon, any trademarks, copyrights, logos, brand names, or other intellectual property mentioned or depicted on this site. Such intellectual property remains the property of its respective owners, and any references here are made solely for identification or informational purposes, without implying any affiliation, endorsement, or partnership.
We make no representations or warranties, express or implied, regarding the accuracy, completeness, or suitability of any content or products presented. Nothing on this website should be construed as legal, tax, investment, financial, medical, or other professional advice. In addition, no part of this site—including articles or product references—constitutes a solicitation, recommendation, endorsement, advertisement, or offer to buy or sell any securities, franchises, or other financial instruments, particularly in jurisdictions where such activity would be unlawful.
All content is of a general nature and may not address the specific circumstances of any individual or entity. It is not a substitute for professional advice or services. Any actions you take based on the information provided here are strictly at your own risk. You accept full responsibility for any decisions or outcomes arising from your use of this website and agree to release us from any liability in connection with your use of, or reliance upon, the content or products found herein.