
|
Peking Easspring Material Technology Co., Ltd. (300073.SZ) DCF -Bewertung |
Fully Editable: Tailor To Your Needs In Excel Or Sheets
Professional Design: Trusted, Industry-Standard Templates
Investor-Approved Valuation Models
MAC/PC Compatible, Fully Unlocked
No Expertise Is Needed; Easy To Follow
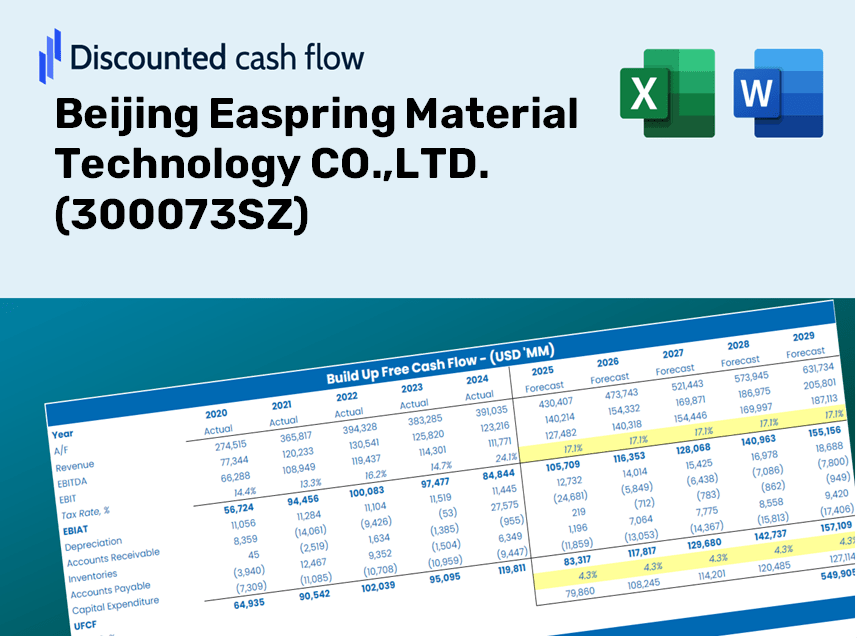
Beijing Easpring Material Technology CO.,LTD. (300073.SZ) Bundle
ROMALLINE PEJING EASPRING MATER MATERIALE TECHNOLOGING CO., LTD. (300073SZ) Bewertung mit diesem anpassbaren DCF -Taschenrechner! Mit dem Zugriff auf echte Peking -Easspring -Finanzdaten und einstellbare Prognoseeingaben können Sie Szenarien untersuchen und den beizulegenden Zeitwert von Peking Easspring in nur wenigen Minuten festlegen.
Discounted Cash Flow (DCF) - (USD MM)
| Year | AY1 2020 |
AY2 2021 |
AY3 2022 |
AY4 2023 |
AY5 2024 |
FY1 2025 |
FY2 2026 |
FY3 2027 |
FY4 2028 |
FY5 2029 |
|---|---|---|---|---|---|---|---|---|---|---|
| Revenue | 3,183.3 | 8,257.9 | 21,264.1 | 15,127.1 | 7,593.1 | 7,233.2 | 6,890.3 | 6,563.7 | 6,252.5 | 5,956.1 |
| Revenue Growth, % | 0 | 159.41 | 157.5 | -28.86 | -49.8 | -4.74 | -4.74 | -4.74 | -4.74 | -4.74 |
| EBITDA | 534.6 | 1,382.5 | 2,704.1 | 2,538.9 | 929.5 | 1,089.0 | 1,037.3 | 988.2 | 941.3 | 896.7 |
| EBITDA, % | 16.79 | 16.74 | 12.72 | 16.78 | 12.24 | 15.06 | 15.06 | 15.06 | 15.06 | 15.06 |
| Depreciation | 78.4 | 129.1 | 170.3 | 268.7 | 392.9 | 170.4 | 162.3 | 154.6 | 147.3 | 140.3 |
| Depreciation, % | 2.46 | 1.56 | 0.80094 | 1.78 | 5.17 | 2.36 | 2.36 | 2.36 | 2.36 | 2.36 |
| EBIT | 456.2 | 1,253.4 | 2,533.8 | 2,270.1 | 536.5 | 918.6 | 875.0 | 833.5 | 794.0 | 756.4 |
| EBIT, % | 14.33 | 15.18 | 11.92 | 15.01 | 7.07 | 12.7 | 12.7 | 12.7 | 12.7 | 12.7 |
| Total Cash | 2,437.9 | 7,304.1 | 7,216.2 | 6,843.0 | 7,552.9 | 4,971.7 | 4,736.1 | 4,511.5 | 4,297.7 | 4,094.0 |
| Total Cash, percent | .0 | .0 | .0 | .0 | .0 | .0 | .0 | .0 | .0 | .0 |
| Account Receivables | 1,130.9 | 3,018.1 | 7,311.5 | 4,798.5 | 2,902.9 | 2,552.0 | 2,431.0 | 2,315.8 | 2,206.0 | 2,101.5 |
| Account Receivables, % | 35.53 | 36.55 | 34.38 | 31.72 | 38.23 | 35.28 | 35.28 | 35.28 | 35.28 | 35.28 |
| Inventories | 522.9 | 1,439.5 | 2,865.1 | 693.0 | 1,060.0 | 952.9 | 907.7 | 864.7 | 823.7 | 784.7 |
| Inventories, % | 16.42 | 17.43 | 13.47 | 4.58 | 13.96 | 13.17 | 13.17 | 13.17 | 13.17 | 13.17 |
| Accounts Payable | 1,676.4 | 4,350.9 | 9,018.1 | 1,293.3 | 2,416.1 | 2,721.6 | 2,592.5 | 2,469.6 | 2,352.6 | 2,241.1 |
| Accounts Payable, % | 52.66 | 52.69 | 42.41 | 8.55 | 31.82 | 37.63 | 37.63 | 37.63 | 37.63 | 37.63 |
| Capital Expenditure | -542.9 | -618.2 | -1,117.0 | -1,331.8 | -871.4 | -724.4 | -690.0 | -657.3 | -626.2 | -596.5 |
| Capital Expenditure, % | -17.05 | -7.49 | -5.25 | -8.8 | -11.48 | -10.01 | -10.01 | -10.01 | -10.01 | -10.01 |
| Tax Rate, % | 11.94 | 11.94 | 11.94 | 11.94 | 11.94 | 11.94 | 11.94 | 11.94 | 11.94 | 11.94 |
| EBITAT | 387.6 | 1,094.9 | 2,254.8 | 1,940.4 | 472.4 | 798.9 | 761.0 | 724.9 | 690.6 | 657.8 |
| Depreciation | ||||||||||
| Changes in Account Receivables | ||||||||||
| Changes in Inventories | ||||||||||
| Changes in Accounts Payable | ||||||||||
| Capital Expenditure | ||||||||||
| UFCF | -54.3 | 476.6 | 256.3 | -2,162.3 | 2,645.4 | 1,008.3 | 270.4 | 257.6 | 245.4 | 233.7 |
| WACC, % | 7.71 | 7.71 | 7.71 | 7.71 | 7.71 | 7.71 | 7.71 | 7.71 | 7.71 | 7.71 |
| PV UFCF | ||||||||||
| SUM PV UFCF | 1,718.7 | |||||||||
| Long Term Growth Rate, % | 3.00 | |||||||||
| Free cash flow (T + 1) | 241 | |||||||||
| Terminal Value | 5,108 | |||||||||
| Present Terminal Value | 3,523 | |||||||||
| Enterprise Value | 5,242 | |||||||||
| Net Debt | -5,853 | |||||||||
| Equity Value | 11,094 | |||||||||
| Diluted Shares Outstanding, MM | 507 | |||||||||
| Equity Value Per Share | 21.90 |
What You Will Receive
- Real BEIJING EASPRING Financial Data: Pre-loaded with historical and forecasted data for accurate analysis.
- Completely Customizable Template: Easily adjust important inputs such as revenue growth, WACC, and EBITDA percentage.
- Automatic Calculations: Witness instant updates to Beijing Easpring’s intrinsic value based on your modifications.
- Professional Valuation Tool: Tailored for investors, analysts, and consultants aiming for precise DCF outcomes.
- Intuitive Design: Clear layout and straightforward instructions suitable for all skill levels.
Key Features
- Authentic Financial Data: Access reliable historical figures and future forecasts for Beijing Easpring Material Technology CO.,LTD. (300073SZ).
- Customizable Forecast Inputs: Modify highlighted cells for key metrics such as WACC, growth rates, and profit margins.
- Automated Calculations: Real-time updates for DCF, Net Present Value (NPV), and cash flow evaluations.
- User-Friendly Dashboard: Clear charts and summaries to help illustrate your valuation outcomes.
- Designed for All Users: A straightforward, intuitive layout tailored for investors, CFOs, and consultants alike.
How It Works
- Step 1: Download the prebuilt Excel template featuring data for Beijing Easpring Material Technology CO.,LTD. (300073SZ).
- Step 2: Navigate through the pre-filled sheets to grasp the essential metrics.
- Step 3: Modify forecasts and assumptions in the editable yellow cells (WACC, growth, margins).
- Step 4: Instantly see updated results, including the intrinsic value of Beijing Easpring Material Technology CO.,LTD. (300073SZ).
- Step 5: Make informed investment choices or create reports based on the outputs.
Why Select This Calculator for Beijing Easpring Material Technology CO.,LTD. (300073SZ)?
- Designed for Experts: A sophisticated tool utilized by industry analysts, CFOs, and consultants.
- Accurate Data: Comprehensive historical and projected financials for Easpring preloaded for precision.
- Forecast Scenarios: Effortlessly simulate various projections and assumptions.
- Insightful Outputs: Automatically computes intrinsic value, NPV, and essential financial metrics.
- User-Friendly: Step-by-step guidance makes the process simple and efficient.
Who Can Benefit from This Product?
- Professional Investors: Develop in-depth and trustworthy valuation models for analyzing portfolios featuring Beijing Easpring Material Technology CO.,LTD. (300073SZ).
- Corporate Finance Teams: Evaluate valuation scenarios to inform strategic decisions within the organization.
- Consultants and Advisors: Equip clients with precise valuation insights related to Beijing Easpring Material Technology CO.,LTD. (300073SZ).
- Students and Educators: Utilize real-time data for hands-on experience in financial modeling and education.
- Tech Enthusiasts: Gain insights into the market valuation of innovative companies like Beijing Easpring Material Technology CO.,LTD. (300073SZ).
What the Template Contains
- Preloaded BEAM Data: Historical and projected financial information, including revenue, EBIT, and capital expenditures.
- DCF and WACC Models: Advanced spreadsheets for calculating intrinsic value and Weighted Average Cost of Capital.
- Editable Inputs: Yellow-highlighted cells for modifying revenue growth, tax rates, and discount rates.
- Financial Statements: Detailed annual and quarterly financial reports for in-depth analysis.
- Key Ratios: Metrics for profitability, leverage, and efficiency to assess performance.
- Dashboard and Charts: Visual representations of valuation results and underlying assumptions.
Disclaimer
All information, articles, and product details provided on this website are for general informational and educational purposes only. We do not claim any ownership over, nor do we intend to infringe upon, any trademarks, copyrights, logos, brand names, or other intellectual property mentioned or depicted on this site. Such intellectual property remains the property of its respective owners, and any references here are made solely for identification or informational purposes, without implying any affiliation, endorsement, or partnership.
We make no representations or warranties, express or implied, regarding the accuracy, completeness, or suitability of any content or products presented. Nothing on this website should be construed as legal, tax, investment, financial, medical, or other professional advice. In addition, no part of this site—including articles or product references—constitutes a solicitation, recommendation, endorsement, advertisement, or offer to buy or sell any securities, franchises, or other financial instruments, particularly in jurisdictions where such activity would be unlawful.
All content is of a general nature and may not address the specific circumstances of any individual or entity. It is not a substitute for professional advice or services. Any actions you take based on the information provided here are strictly at your own risk. You accept full responsibility for any decisions or outcomes arising from your use of this website and agree to release us from any liability in connection with your use of, or reliance upon, the content or products found herein.