
|
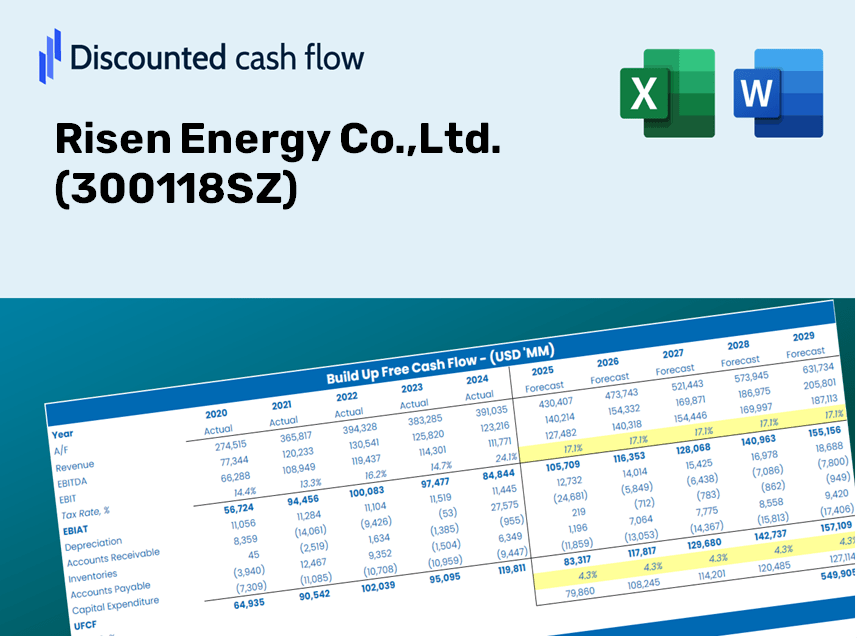
Risien Energy Co., Ltd. (300118.sz) DCF -Bewertung |
Fully Editable: Tailor To Your Needs In Excel Or Sheets
Professional Design: Trusted, Industry-Standard Templates
Investor-Approved Valuation Models
MAC/PC Compatible, Fully Unlocked
No Expertise Is Needed; Easy To Follow
Risen Energy Co.,Ltd. (300118.SZ) Bundle
Optimieren Sie Ihre Zeit und verbessern Sie Ihre Präzision mit unserem DCF -Taschenrechner (300118SZ)! Mit tatsächlichen Daten von Risen Energy Co., Ltd. und anpassbaren Annahmen ermöglichen dieses Tool Sie, wie ein erfahrener Investor die Energie zu prognostizieren, zu analysieren und zu bewerten.
Discounted Cash Flow (DCF) - (USD MM)
| Year | AY1 2020 |
AY2 2021 |
AY3 2022 |
AY4 2023 |
AY5 2024 |
FY1 2025 |
FY2 2026 |
FY3 2027 |
FY4 2028 |
FY5 2029 |
|---|---|---|---|---|---|---|---|---|---|---|
| Revenue | 16,063.5 | 18,830.7 | 29,384.7 | 35,326.8 | 20,239.3 | 22,809.1 | 25,705.1 | 28,968.8 | 32,646.9 | 36,792.0 |
| Revenue Growth, % | 0 | 17.23 | 56.05 | 20.22 | -42.71 | 12.7 | 12.7 | 12.7 | 12.7 | 12.7 |
| EBITDA | 1,557.4 | 1,083.5 | 2,541.0 | 3,523.3 | -1,277.7 | 1,266.2 | 1,427.0 | 1,608.2 | 1,812.4 | 2,042.5 |
| EBITDA, % | 9.7 | 5.75 | 8.65 | 9.97 | -6.31 | 5.55 | 5.55 | 5.55 | 5.55 | 5.55 |
| Depreciation | 888.6 | 832.1 | 1,075.1 | 1,503.9 | 2,087.1 | 1,285.4 | 1,448.7 | 1,632.6 | 1,839.9 | 2,073.5 |
| Depreciation, % | 5.53 | 4.42 | 3.66 | 4.26 | 10.31 | 5.64 | 5.64 | 5.64 | 5.64 | 5.64 |
| EBIT | 668.9 | 251.5 | 1,465.9 | 2,019.4 | -3,364.8 | -19.2 | -21.6 | -24.4 | -27.5 | -31.0 |
| EBIT, % | 4.16 | 1.34 | 4.99 | 5.72 | -16.63 | -0.08420753 | -0.08420753 | -0.08420753 | -0.08420753 | -0.08420753 |
| Total Cash | 5,806.2 | 5,339.4 | 9,921.6 | 10,656.2 | 5,238.0 | 7,039.3 | 7,933.1 | 8,940.3 | 10,075.5 | 11,354.7 |
| Total Cash, percent | .0 | .0 | .0 | .0 | .0 | .0 | .0 | .0 | .0 | .0 |
| Account Receivables | 4,610.0 | 3,004.9 | 4,324.6 | 6,528.0 | 5,604.3 | 4,814.6 | 5,425.9 | 6,114.8 | 6,891.2 | 7,766.2 |
| Account Receivables, % | 28.7 | 15.96 | 14.72 | 18.48 | 27.69 | 21.11 | 21.11 | 21.11 | 21.11 | 21.11 |
| Inventories | 1,558.1 | 3,030.6 | 6,402.3 | 5,568.3 | 3,131.9 | 3,595.5 | 4,052.1 | 4,566.5 | 5,146.3 | 5,799.8 |
| Inventories, % | 9.7 | 16.09 | 21.79 | 15.76 | 15.47 | 15.76 | 15.76 | 15.76 | 15.76 | 15.76 |
| Accounts Payable | 8,650.3 | 10,382.5 | 13,555.6 | 18,371.4 | 10,217.3 | 11,751.4 | 13,243.5 | 14,925.0 | 16,819.9 | 18,955.5 |
| Accounts Payable, % | 53.85 | 55.14 | 46.13 | 52 | 50.48 | 51.52 | 51.52 | 51.52 | 51.52 | 51.52 |
| Capital Expenditure | -893.2 | -4,045.9 | -2,107.5 | -4,597.2 | -2,209.1 | -2,652.6 | -2,989.3 | -3,368.9 | -3,796.6 | -4,278.7 |
| Capital Expenditure, % | -5.56 | -21.49 | -7.17 | -13.01 | -10.92 | -11.63 | -11.63 | -11.63 | -11.63 | -11.63 |
| Tax Rate, % | 14.23 | 14.23 | 14.23 | 14.23 | 14.23 | 14.23 | 14.23 | 14.23 | 14.23 | 14.23 |
| EBITAT | 378.5 | -437.3 | 1,277.3 | 1,882.2 | -2,886.1 | -12.4 | -14.0 | -15.7 | -17.7 | -20.0 |
| Depreciation | ||||||||||
| Changes in Account Receivables | ||||||||||
| Changes in Inventories | ||||||||||
| Changes in Accounts Payable | ||||||||||
| Capital Expenditure | ||||||||||
| UFCF | 2,856.0 | -1,786.4 | -1,273.3 | 2,235.3 | -7,802.1 | 480.6 | -1,130.4 | -1,274.0 | -1,435.7 | -1,618.0 |
| WACC, % | 5.72 | 4.1 | 6.6 | 6.77 | 6.56 | 5.95 | 5.95 | 5.95 | 5.95 | 5.95 |
| PV UFCF | ||||||||||
| SUM PV UFCF | -3,975.7 | |||||||||
| Long Term Growth Rate, % | 3.50 | |||||||||
| Free cash flow (T + 1) | -1,675 | |||||||||
| Terminal Value | -68,335 | |||||||||
| Present Terminal Value | -51,183 | |||||||||
| Enterprise Value | -55,159 | |||||||||
| Net Debt | 6,425 | |||||||||
| Equity Value | -61,585 | |||||||||
| Diluted Shares Outstanding, MM | 1,130 | |||||||||
| Equity Value Per Share | -54.49 |
What You Will Receive
- Authentic Risen Energy Financial Data: Pre-loaded with Risen Energy’s historical and projected figures for in-depth analysis.
- Completely Customizable Template: Easily adjust essential inputs such as revenue growth, WACC, and EBITDA percentage.
- Instant Calculation Updates: Observe real-time updates to Risen Energy’s intrinsic value as you make adjustments.
- Professional Valuation Tool: Tailored for investors, analysts, and consultants who require reliable DCF results.
- User-Friendly Interface: Intuitive layout and straightforward instructions suitable for all skill levels.
Key Features
- Comprehensive Historical Data: Risen Energy’s financial statements and projected forecasts are readily available.
- Customizable Inputs: Modify WACC, tax rates, revenue growth, and EBITDA margins to fit your analysis.
- Real-Time Insights: Watch Risen Energy's intrinsic value update instantly.
- Dynamic Visual Presentations: Interactive dashboard charts showcase valuation results and essential metrics.
- Designed for Precision: A robust tool tailored for analysts, investors, and finance professionals.
How It Functions
- 1. Access the Template: Download and open the Excel file containing Risen Energy Co., Ltd.'s preloaded data.
- 2. Modify Inputs: Update essential variables such as growth rates, WACC, and capital expenditures.
- 3. Analyze Results in Real-Time: The DCF model automatically computes intrinsic value and NPV.
- 4. Explore Different Scenarios: Evaluate various forecasts to understand diverse valuation results.
- 5. Present with Assurance: Deliver professional valuation insights to back your investment decisions for Risen Energy Co., Ltd. (300118SZ).
Why Choose This Calculator for Risen Energy Co., Ltd. (300118SZ)?
- Accuracy: Leveraging real Risen Energy financials ensures precise data.
- Flexibility: Users can easily test and adjust inputs as needed.
- Time-Saving: Eliminate the complexities of creating a DCF model from the ground up.
- Professional-Grade: Crafted with the precision and usability expected at the CFO level.
- User-Friendly: Intuitive interface suitable for users with varying levels of financial expertise.
Who Can Benefit from This Product?
- Finance Students: Master valuation methods and practice with real market data for Risen Energy Co.,Ltd. (300118SZ).
- Academics: Integrate industry-standard models into your lessons or research projects.
- Investors: Evaluate your investment strategies and assess valuation metrics for Risen Energy Co.,Ltd. (300118SZ).
- Analysts: Enhance your productivity with a ready-to-use, customizable DCF (Discounted Cash Flow) model.
- Small Business Owners: Discover how large public firms like Risen Energy Co.,Ltd. (300118SZ) are appraised.
Components of the Template
- Preloaded Risen Energy Data: Historical and forecasted financial metrics, including revenue, EBIT, and capital expenditures.
- DCF and WACC Models: Advanced sheets for calculating intrinsic value and Weighted Average Cost of Capital.
- Editable Inputs: Yellow-highlighted cells for modifying revenue growth, tax rates, and discount rates.
- Financial Statements: Detailed annual and quarterly financial documents for in-depth analysis.
- Key Ratios: Profitability, leverage, and efficiency ratios to assess performance.
- Dashboard and Charts: Visual representations of valuation results and assumptions.
Disclaimer
All information, articles, and product details provided on this website are for general informational and educational purposes only. We do not claim any ownership over, nor do we intend to infringe upon, any trademarks, copyrights, logos, brand names, or other intellectual property mentioned or depicted on this site. Such intellectual property remains the property of its respective owners, and any references here are made solely for identification or informational purposes, without implying any affiliation, endorsement, or partnership.
We make no representations or warranties, express or implied, regarding the accuracy, completeness, or suitability of any content or products presented. Nothing on this website should be construed as legal, tax, investment, financial, medical, or other professional advice. In addition, no part of this site—including articles or product references—constitutes a solicitation, recommendation, endorsement, advertisement, or offer to buy or sell any securities, franchises, or other financial instruments, particularly in jurisdictions where such activity would be unlawful.
All content is of a general nature and may not address the specific circumstances of any individual or entity. It is not a substitute for professional advice or services. Any actions you take based on the information provided here are strictly at your own risk. You accept full responsibility for any decisions or outcomes arising from your use of this website and agree to release us from any liability in connection with your use of, or reliance upon, the content or products found herein.