
|
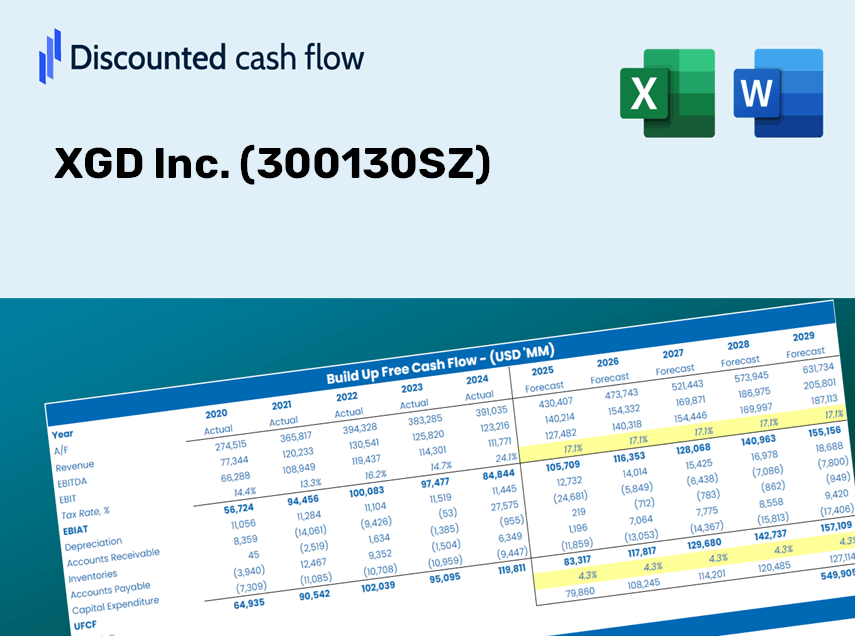
XGD Inc. (300130.SZ) DCF -Bewertung |
Fully Editable: Tailor To Your Needs In Excel Or Sheets
Professional Design: Trusted, Industry-Standard Templates
Investor-Approved Valuation Models
MAC/PC Compatible, Fully Unlocked
No Expertise Is Needed; Easy To Follow
XGD Inc. (300130.SZ) Bundle
Unabhängig davon, ob Sie ein Investor oder ein Analyst sind, ist dieser DCF -Taschenrechner (300130SZ) Ihr wesentliches Werkzeug für eine genaue Bewertung. Mit XGD Inc. Real Data vorinstalliert, können Sie Prognosen anpassen und die Effekte in Echtzeit sehen.
Discounted Cash Flow (DCF) - (USD MM)
| Year | AY1 2020 |
AY2 2021 |
AY3 2022 |
AY4 2023 |
AY5 2024 |
FY1 2025 |
FY2 2026 |
FY3 2027 |
FY4 2028 |
FY5 2029 |
|---|---|---|---|---|---|---|---|---|---|---|
| Revenue | 2,632.4 | 3,611.7 | 4,316.5 | 3,801.3 | 3,147.5 | 3,364.6 | 3,596.6 | 3,844.7 | 4,109.8 | 4,393.2 |
| Revenue Growth, % | 0 | 37.21 | 19.51 | -11.94 | -17.2 | 6.9 | 6.9 | 6.9 | 6.9 | 6.9 |
| EBITDA | 164.6 | 169.9 | 296.2 | 702.2 | 550.5 | 361.9 | 386.9 | 413.5 | 442.0 | 472.5 |
| EBITDA, % | 6.25 | 4.7 | 6.86 | 18.47 | 17.49 | 10.76 | 10.76 | 10.76 | 10.76 | 10.76 |
| Depreciation | 15.0 | 28.9 | 44.7 | 46.5 | 31.4 | 31.1 | 33.3 | 35.6 | 38.0 | 40.7 |
| Depreciation, % | 0.56988 | 0.79971 | 1.04 | 1.22 | 0.99891 | 0.92555 | 0.92555 | 0.92555 | 0.92555 | 0.92555 |
| EBIT | 149.6 | 141.0 | 251.5 | 655.7 | 519.0 | 330.8 | 353.6 | 377.9 | 404.0 | 431.9 |
| EBIT, % | 5.68 | 3.9 | 5.83 | 17.25 | 16.49 | 9.83 | 9.83 | 9.83 | 9.83 | 9.83 |
| Total Cash | 1,596.4 | 1,755.3 | 1,841.0 | 3,640.3 | 4,012.8 | 2,339.5 | 2,500.8 | 2,673.3 | 2,857.6 | 3,054.7 |
| Total Cash, percent | .0 | .0 | .0 | .0 | .0 | .0 | .0 | .0 | .0 | .0 |
| Account Receivables | 468.0 | 500.0 | 516.7 | 335.4 | 340.1 | 425.4 | 454.8 | 486.1 | 519.7 | 555.5 |
| Account Receivables, % | 17.78 | 13.84 | 11.97 | 8.82 | 10.81 | 12.64 | 12.64 | 12.64 | 12.64 | 12.64 |
| Inventories | 162.8 | 252.3 | 237.5 | 121.1 | 99.4 | 168.3 | 180.0 | 192.4 | 205.6 | 219.8 |
| Inventories, % | 6.18 | 6.99 | 5.5 | 3.19 | 3.16 | 5 | 5 | 5 | 5 | 5 |
| Accounts Payable | 296.4 | 416.5 | 401.4 | 455.3 | 525.9 | 409.0 | 437.2 | 467.3 | 499.6 | 534.0 |
| Accounts Payable, % | 11.26 | 11.53 | 9.3 | 11.98 | 16.71 | 12.16 | 12.16 | 12.16 | 12.16 | 12.16 |
| Capital Expenditure | -19.4 | -22.7 | -22.7 | -11.5 | -21.5 | -19.4 | -20.7 | -22.1 | -23.6 | -25.3 |
| Capital Expenditure, % | -0.73604 | -0.62911 | -0.5266 | -0.30138 | -0.68317 | -0.57526 | -0.57526 | -0.57526 | -0.57526 | -0.57526 |
| Tax Rate, % | -11.59 | -11.59 | -11.59 | -11.59 | -11.59 | -11.59 | -11.59 | -11.59 | -11.59 | -11.59 |
| EBITAT | 135.5 | 128.0 | 193.9 | 642.2 | 579.1 | 301.9 | 322.7 | 345.0 | 368.8 | 394.2 |
| Depreciation | ||||||||||
| Changes in Account Receivables | ||||||||||
| Changes in Inventories | ||||||||||
| Changes in Accounts Payable | ||||||||||
| Capital Expenditure | ||||||||||
| UFCF | -203.3 | 132.8 | 198.9 | 1,029.0 | 676.5 | 42.6 | 322.6 | 344.8 | 368.6 | 394.1 |
| WACC, % | 4.67 | 4.67 | 4.67 | 4.68 | 4.68 | 4.67 | 4.67 | 4.67 | 4.67 | 4.67 |
| PV UFCF | ||||||||||
| SUM PV UFCF | 1,256.5 | |||||||||
| Long Term Growth Rate, % | 3.50 | |||||||||
| Free cash flow (T + 1) | 408 | |||||||||
| Terminal Value | 34,766 | |||||||||
| Present Terminal Value | 27,668 | |||||||||
| Enterprise Value | 28,925 | |||||||||
| Net Debt | -3,913 | |||||||||
| Equity Value | 32,838 | |||||||||
| Diluted Shares Outstanding, MM | 558 | |||||||||
| Equity Value Per Share | 58.89 |
What You Will Receive
- Genuine XGD Financial Data: Access to comprehensive historical and projected data for precise valuation.
- Customizable Parameters: Adjust WACC, tax rates, revenue growth, and capital expenses to suit your analysis.
- Automated Calculations: Dynamic calculations for intrinsic value and NPV are provided.
- Scenario Testing: Evaluate various scenarios to assess the future performance of XGD Inc. (300130SZ).
- User-Friendly and Professional Design: Designed for industry experts while remaining approachable for newcomers.
Key Features
- Comprehensive DCF Calculator: Provides intricate unlevered and levered DCF valuation models tailored for XGD Inc. (300130SZ).
- Customizable WACC Calculator: Features a pre-designed Weighted Average Cost of Capital sheet with adjustable inputs specific to XGD Inc. (300130SZ).
- Flexible Forecast Assumptions: Easily update growth rates, capital expenditures, and discount rates relevant to XGD Inc. (300130SZ).
- Integrated Financial Ratios: Evaluate profitability, leverage, and efficiency ratios associated with XGD Inc. (300130SZ).
- Visual Dashboard and Charts: Graphical representations that encapsulate key valuation metrics for straightforward analysis of XGD Inc. (300130SZ).
How It Operates
- Download: Obtain the pre-configured Excel file featuring XGD Inc.’s (300130SZ) financial data.
- Customize: Modify forecasts such as revenue growth, EBITDA percentage, and WACC.
- Update Automatically: Watch as intrinsic value and NPV calculations refresh in real-time.
- Test Scenarios: Generate various projections and instantly compare the results.
- Make Decisions: Leverage the valuation outcomes to inform your investment strategy.
Why Opt for XGD Inc. (300130SZ) Calculator?
- Precision: Utilizes accurate financial data from XGD Inc. for reliable calculations.
- Adaptability: Crafted for users to easily experiment with and modify their inputs.
- Efficiency: Eliminate the complexities of constructing a DCF model from the ground up.
- Expert-Level: Designed with the care and precision expected from CFOs.
- Easy to Use: Intuitive interface accessible to those with no advanced financial modeling background.
Who Can Benefit from XGD Inc. (300130SZ)?
- Finance Students: Discover valuation methods and practice using real market data.
- Academics: Integrate industry-standard models into your teaching or research initiatives.
- Investors: Validate your investment hypotheses and evaluate valuation scenarios for XGD Inc. (300130SZ).
- Analysts: Enhance your efficiency with a customizable DCF model designed for ease of use.
- Small Business Owners: Understand the analytic approaches utilized for evaluating major publicly traded companies like XGD Inc. (300130SZ).
Contents of the Template
- Pre-Filled Data: Contains XGD Inc.'s historical financial information and projections.
- Discounted Cash Flow Model: An editable DCF valuation model featuring automatic calculations.
- Weighted Average Cost of Capital (WACC): A specific sheet designed for WACC calculations based on user-defined inputs.
- Key Financial Ratios: Evaluate XGD Inc.'s profitability, operational efficiency, and financial leverage.
- Customizable Inputs: Adjust revenue growth, profit margins, and tax rates effortlessly.
- Clear Dashboard: Visual representations and tables showcasing essential valuation outcomes.
Disclaimer
All information, articles, and product details provided on this website are for general informational and educational purposes only. We do not claim any ownership over, nor do we intend to infringe upon, any trademarks, copyrights, logos, brand names, or other intellectual property mentioned or depicted on this site. Such intellectual property remains the property of its respective owners, and any references here are made solely for identification or informational purposes, without implying any affiliation, endorsement, or partnership.
We make no representations or warranties, express or implied, regarding the accuracy, completeness, or suitability of any content or products presented. Nothing on this website should be construed as legal, tax, investment, financial, medical, or other professional advice. In addition, no part of this site—including articles or product references—constitutes a solicitation, recommendation, endorsement, advertisement, or offer to buy or sell any securities, franchises, or other financial instruments, particularly in jurisdictions where such activity would be unlawful.
All content is of a general nature and may not address the specific circumstances of any individual or entity. It is not a substitute for professional advice or services. Any actions you take based on the information provided here are strictly at your own risk. You accept full responsibility for any decisions or outcomes arising from your use of this website and agree to release us from any liability in connection with your use of, or reliance upon, the content or products found herein.