
|
By-Health Co., Ltd. (300146.sz) DCF-Bewertung |
Fully Editable: Tailor To Your Needs In Excel Or Sheets
Professional Design: Trusted, Industry-Standard Templates
Investor-Approved Valuation Models
MAC/PC Compatible, Fully Unlocked
No Expertise Is Needed; Easy To Follow
By-health Co., Ltd. (300146.SZ) Bundle
Verbessern Sie Ihre Investitionsauswahl mit dem [Symbol] DCF -Taschenrechner! Erforschen Sie Real By-Health Co., Ltd. Financials, passen Sie Wachstumsprognosen und -kosten an und beobachten Sie sofort, wie sich diese Veränderungen auf den intrinsischen Wert [Symbol] auswirken.
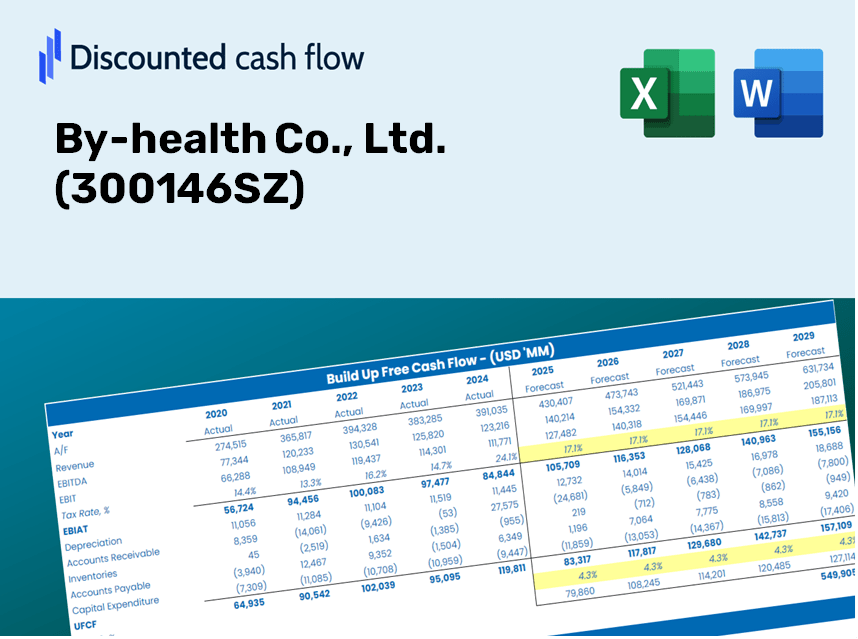
Discounted Cash Flow (DCF) - (USD MM)
| Year | AY1 2020 |
AY2 2021 |
AY3 2022 |
AY4 2023 |
AY5 2024 |
FY1 2025 |
FY2 2026 |
FY3 2027 |
FY4 2028 |
FY5 2029 |
|---|---|---|---|---|---|---|---|---|---|---|
| Revenue | 6,094.9 | 7,431.3 | 7,861.4 | 9,406.8 | 6,838.4 | 7,225.1 | 7,633.7 | 8,065.4 | 8,521.5 | 9,003.3 |
| Revenue Growth, % | 0 | 21.93 | 5.79 | 19.66 | -27.3 | 5.65 | 5.65 | 5.65 | 5.65 | 5.65 |
| EBITDA | 1,566.6 | 2,011.9 | 1,773.1 | 2,071.5 | 964.1 | 1,610.5 | 1,701.6 | 1,797.8 | 1,899.5 | 2,006.9 |
| EBITDA, % | 25.7 | 27.07 | 22.55 | 22.02 | 14.1 | 22.29 | 22.29 | 22.29 | 22.29 | 22.29 |
| Depreciation | 205.2 | 215.4 | 212.2 | 224.9 | 220.1 | 210.6 | 222.5 | 235.1 | 248.4 | 262.4 |
| Depreciation, % | 3.37 | 2.9 | 2.7 | 2.39 | 3.22 | 2.91 | 2.91 | 2.91 | 2.91 | 2.91 |
| EBIT | 1,361.4 | 1,796.5 | 1,561.0 | 1,846.6 | 744.0 | 1,399.9 | 1,479.1 | 1,562.7 | 1,651.1 | 1,744.4 |
| EBIT, % | 22.34 | 24.17 | 19.86 | 19.63 | 10.88 | 19.38 | 19.38 | 19.38 | 19.38 | 19.38 |
| Total Cash | 1,867.0 | 3,142.3 | 4,791.0 | 6,438.1 | 4,597.4 | 3,894.8 | 4,115.0 | 4,347.7 | 4,593.6 | 4,853.4 |
| Total Cash, percent | .0 | .0 | .0 | .0 | .0 | .0 | .0 | .0 | .0 | .0 |
| Account Receivables | 340.6 | 412.8 | 477.9 | 366.2 | 266.8 | 361.5 | 381.9 | 403.5 | 426.3 | 450.4 |
| Account Receivables, % | 5.59 | 5.55 | 6.08 | 3.89 | 3.9 | 5 | 5 | 5 | 5 | 5 |
| Inventories | 872.7 | 832.8 | 898.9 | 989.1 | 608.9 | 814.7 | 860.7 | 909.4 | 960.8 | 1,015.2 |
| Inventories, % | 14.32 | 11.21 | 11.43 | 10.51 | 8.9 | 11.28 | 11.28 | 11.28 | 11.28 | 11.28 |
| Accounts Payable | 349.6 | 408.1 | 366.9 | 426.6 | 239.9 | 345.9 | 365.5 | 386.1 | 408.0 | 431.0 |
| Accounts Payable, % | 5.74 | 5.49 | 4.67 | 4.53 | 3.51 | 4.79 | 4.79 | 4.79 | 4.79 | 4.79 |
| Capital Expenditure | -321.7 | -263.2 | -244.8 | -1,257.3 | -305.7 | -430.2 | -454.5 | -480.2 | -507.4 | -536.1 |
| Capital Expenditure, % | -5.28 | -3.54 | -3.11 | -13.37 | -4.47 | -5.95 | -5.95 | -5.95 | -5.95 | -5.95 |
| Tax Rate, % | 27.51 | 27.51 | 27.51 | 27.51 | 27.51 | 27.51 | 27.51 | 27.51 | 27.51 | 27.51 |
| EBITAT | 1,173.2 | 1,446.8 | 1,268.9 | 1,468.5 | 539.3 | 1,120.0 | 1,183.3 | 1,250.2 | 1,320.9 | 1,395.6 |
| Depreciation | ||||||||||
| Changes in Account Receivables | ||||||||||
| Changes in Inventories | ||||||||||
| Changes in Accounts Payable | ||||||||||
| Capital Expenditure | ||||||||||
| UFCF | 193.1 | 1,425.1 | 1,063.9 | 517.3 | 746.6 | 705.9 | 904.3 | 955.5 | 1,009.5 | 1,066.6 |
| WACC, % | 6.06 | 6.04 | 6.05 | 6.04 | 6.02 | 6.04 | 6.04 | 6.04 | 6.04 | 6.04 |
| PV UFCF | ||||||||||
| SUM PV UFCF | 3,864.9 | |||||||||
| Long Term Growth Rate, % | 3.00 | |||||||||
| Free cash flow (T + 1) | 1,099 | |||||||||
| Terminal Value | 36,102 | |||||||||
| Present Terminal Value | 26,922 | |||||||||
| Enterprise Value | 30,787 | |||||||||
| Net Debt | -1,054 | |||||||||
| Equity Value | 31,842 | |||||||||
| Diluted Shares Outstanding, MM | 1,718 | |||||||||
| Equity Value Per Share | 18.53 |
What You Will Receive
- Authentic BY-HEALTH Financial Data: Preloaded with the historical and projected financial figures for precise evaluations.
- Customizable Template: Easily adjust crucial inputs like revenue growth rate, WACC, and EBITDA % to suit your analysis.
- Instant Calculations: Track updates to BY-HEALTH’s intrinsic value in real-time as you make adjustments.
- Expert Valuation Tool: Tailored for investors, analysts, and consultants in pursuit of reliable DCF results.
- Intuitive Design: Organized layout and straightforward instructions suitable for users of all skill levels.
Key Features
- Pre-Loaded Data: By-health Co., Ltd.’s historical financial statements and forecast data are readily available.
- Fully Adjustable Inputs: Customize WACC, tax rates, revenue growth, and EBITDA margins as needed.
- Instant Results: View By-health Co., Ltd.’s intrinsic value recalculating in real-time.
- Clear Visual Outputs: Dashboard charts present valuation outcomes and essential metrics clearly.
- Built for Accuracy: A professional-grade tool designed for analysts, investors, and finance professionals.
How It Functions
- Download: Obtain the pre-packaged Excel file containing By-health Co., Ltd.'s (300146SZ) financial data.
- Customize: Modify forecasts such as revenue growth, EBITDA %, and WACC to suit your analysis.
- Update Automatically: Watch as intrinsic value and NPV calculations refresh in real-time.
- Test Scenarios: Generate various projections and instantly compare the results.
- Make Decisions: Leverage the valuation outcomes to inform your investment approach.
Why Opt for This Calculator?
- Reliable Data: Utilizes authentic By-health Co., Ltd. (300146SZ) financials for dependable valuation outcomes.
- Flexible Customization: Modify essential variables such as growth rates, WACC, and tax rates to align with your forecasts.
- Efficiency Boost: Pre-configured calculations save you the hassle of starting from ground zero.
- Expert-Level Tool: Tailored for investors, analysts, and consultants.
- User-Centric Design: Clear layout and guided instructions make it accessible for all users.
Who Can Benefit from This Product?
- Investors: Accurately assess By-health Co., Ltd.'s (300146SZ) fair value before making investment choices.
- CFOs: Utilize a high-caliber DCF model for financial reporting and analysis tailored to By-health Co., Ltd. (300146SZ).
- Consultants: Efficiently customize the template for client valuation reports specific to By-health Co., Ltd. (300146SZ).
- Entrepreneurs: Acquire insights into the financial modeling practices of leading companies like By-health Co., Ltd. (300146SZ).
- Educators: Employ it as an instructional resource to illustrate valuation techniques relevant to By-health Co., Ltd. (300146SZ).
Contents of the Template
- Pre-Filled DCF Model: By-health Co., Ltd.'s financial data preloaded for immediate analysis.
- WACC Calculator: Comprehensive calculations for Weighted Average Cost of Capital.
- Financial Ratios: Assess By-health Co., Ltd.'s profitability, leverage, and operational efficiency.
- Editable Inputs: Modify assumptions like growth rates, profit margins, and CAPEX to align with your scenarios.
- Financial Statements: Annual and quarterly reports available for in-depth evaluation.
- Interactive Dashboard: Effortlessly visualize critical valuation metrics and outcomes.
Disclaimer
All information, articles, and product details provided on this website are for general informational and educational purposes only. We do not claim any ownership over, nor do we intend to infringe upon, any trademarks, copyrights, logos, brand names, or other intellectual property mentioned or depicted on this site. Such intellectual property remains the property of its respective owners, and any references here are made solely for identification or informational purposes, without implying any affiliation, endorsement, or partnership.
We make no representations or warranties, express or implied, regarding the accuracy, completeness, or suitability of any content or products presented. Nothing on this website should be construed as legal, tax, investment, financial, medical, or other professional advice. In addition, no part of this site—including articles or product references—constitutes a solicitation, recommendation, endorsement, advertisement, or offer to buy or sell any securities, franchises, or other financial instruments, particularly in jurisdictions where such activity would be unlawful.
All content is of a general nature and may not address the specific circumstances of any individual or entity. It is not a substitute for professional advice or services. Any actions you take based on the information provided here are strictly at your own risk. You accept full responsibility for any decisions or outcomes arising from your use of this website and agree to release us from any liability in connection with your use of, or reliance upon, the content or products found herein.