
|
Xinjiang Machinery Research Institute Co., Ltd. (300159.SZ) DCF -Bewertung |
Fully Editable: Tailor To Your Needs In Excel Or Sheets
Professional Design: Trusted, Industry-Standard Templates
Investor-Approved Valuation Models
MAC/PC Compatible, Fully Unlocked
No Expertise Is Needed; Easy To Follow
Xinjiang Machinery Research Institute Co., Ltd. (300159.SZ) Bundle
Egal, ob Sie ein Investor oder Analyst sind, dieser DCF-Taschenrechner (300159SZ) ist Ihre Anlaufstelle für eine genaue Bewertung. Ausgestattet mit echten Daten des Xinjiang Machinery Research Institute Co., Ltd., können Sie Prognosen anpassen und die Auswirkungen sofort beobachten.
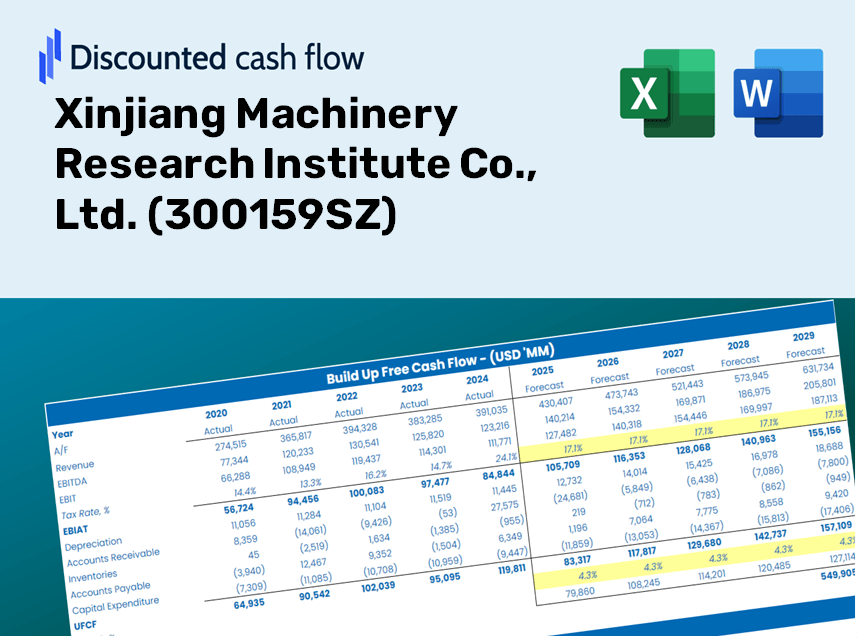
Discounted Cash Flow (DCF) - (USD MM)
| Year | AY1 2020 |
AY2 2021 |
AY3 2022 |
AY4 2023 |
AY5 2024 |
FY1 2025 |
FY2 2026 |
FY3 2027 |
FY4 2028 |
FY5 2029 |
|---|---|---|---|---|---|---|---|---|---|---|
| Revenue | 926.3 | 1,362.9 | 2,143.7 | 1,190.7 | 664.9 | 691.2 | 718.5 | 746.9 | 776.4 | 807.1 |
| Revenue Growth, % | 0 | 47.14 | 57.28 | -44.46 | -44.16 | 3.95 | 3.95 | 3.95 | 3.95 | 3.95 |
| EBITDA | -373.4 | 42.7 | 358.7 | 153.5 | -36.3 | -18.0 | -18.7 | -19.4 | -20.2 | -21.0 |
| EBITDA, % | -40.31 | 3.13 | 16.73 | 12.89 | -5.46 | -2.6 | -2.6 | -2.6 | -2.6 | -2.6 |
| Depreciation | 228.3 | 183.0 | 132.9 | 127.5 | 142.2 | 105.6 | 109.7 | 114.1 | 118.6 | 123.3 |
| Depreciation, % | 24.64 | 13.42 | 6.2 | 10.71 | 21.39 | 15.27 | 15.27 | 15.27 | 15.27 | 15.27 |
| EBIT | -601.7 | -140.3 | 225.8 | 26.0 | -178.5 | -123.6 | -128.4 | -133.5 | -138.8 | -144.3 |
| EBIT, % | -64.96 | -10.29 | 10.53 | 2.18 | -26.85 | -17.88 | -17.88 | -17.88 | -17.88 | -17.88 |
| Total Cash | 264.6 | 171.1 | 413.3 | 486.7 | 481.9 | 240.2 | 249.7 | 259.5 | 269.8 | 280.5 |
| Total Cash, percent | .0 | .0 | .0 | .0 | .0 | .0 | .0 | .0 | .0 | .0 |
| Account Receivables | 834.2 | 655.8 | 914.1 | 526.7 | 374.1 | 388.9 | 404.3 | 420.2 | 436.9 | 454.1 |
| Account Receivables, % | 90.05 | 48.12 | 42.64 | 44.24 | 56.26 | 56.26 | 56.26 | 56.26 | 56.26 | 56.26 |
| Inventories | 343.8 | 434.6 | 161.3 | 277.1 | 223.0 | 184.3 | 191.6 | 199.2 | 207.1 | 215.3 |
| Inventories, % | 37.12 | 31.89 | 7.53 | 23.27 | 33.54 | 26.67 | 26.67 | 26.67 | 26.67 | 26.67 |
| Accounts Payable | 571.3 | 490.0 | 547.2 | 281.8 | 225.5 | 249.9 | 259.7 | 270.0 | 280.7 | 291.8 |
| Accounts Payable, % | 61.68 | 35.95 | 25.53 | 23.67 | 33.92 | 36.15 | 36.15 | 36.15 | 36.15 | 36.15 |
| Capital Expenditure | -105.5 | -59.0 | -24.8 | -31.3 | -41.0 | -35.5 | -36.9 | -38.3 | -39.9 | -41.4 |
| Capital Expenditure, % | -11.39 | -4.33 | -1.16 | -2.63 | -6.16 | -5.13 | -5.13 | -5.13 | -5.13 | -5.13 |
| Tax Rate, % | 0.53702 | 0.53702 | 0.53702 | 0.53702 | 0.53702 | 0.53702 | 0.53702 | 0.53702 | 0.53702 | 0.53702 |
| EBITAT | -566.5 | -136.1 | 197.7 | 31.8 | -177.6 | -118.2 | -122.8 | -127.7 | -132.7 | -138.0 |
| Depreciation | ||||||||||
| Changes in Account Receivables | ||||||||||
| Changes in Inventories | ||||||||||
| Changes in Accounts Payable | ||||||||||
| Capital Expenditure | ||||||||||
| UFCF | -1,050.5 | -5.9 | 377.9 | 134.3 | 74.1 | .1 | -62.8 | -65.2 | -67.8 | -70.5 |
| WACC, % | 9.23 | 9.31 | 9.06 | 9.38 | 9.37 | 9.27 | 9.27 | 9.27 | 9.27 | 9.27 |
| PV UFCF | ||||||||||
| SUM PV UFCF | -195.3 | |||||||||
| Long Term Growth Rate, % | 4.00 | |||||||||
| Free cash flow (T + 1) | -73 | |||||||||
| Terminal Value | -1,391 | |||||||||
| Present Terminal Value | -893 | |||||||||
| Enterprise Value | -1,089 | |||||||||
| Net Debt | 762 | |||||||||
| Equity Value | -1,850 | |||||||||
| Diluted Shares Outstanding, MM | 1,472 | |||||||||
| Equity Value Per Share | -1.26 |
Benefits You Will Receive
- Editable Assumption Inputs: Easily modify key variables (growth %, profit margins, WACC) to explore different scenarios.
- Real-World Insights: Pre-filled financial data from Xinjiang Machinery Research Institute Co., Ltd. (300159SZ) to kickstart your analysis.
- Automated DCF Calculations: The template provides calculations for Net Present Value (NPV) and intrinsic value effortlessly.
- Custom and Professional Design: A sleek Excel model that can be tailored to meet your valuation requirements.
- Designed for Analysts and Investors: Perfect for assessing forecasts, validating strategies, and improving efficiency.
Key Features
- Comprehensive Machinery Valuation Tool: Features detailed unlevered and levered DCF valuation models tailored for the machinery sector.
- WACC Estimator: Pre-configured Weighted Average Cost of Capital calculator with adjustable parameters.
- Customizable Forecast Parameters: Adjust projections for growth rates, capital investments, and discount rates as needed.
- Integrated Financial Metrics: Examine profitability, leverage, and operational efficiency ratios specific to Xinjiang Machinery Research Institute Co., Ltd. (300159SZ).
- Visual Dashboard and Charts: Graphical representations of key valuation metrics for streamlined analysis.
How It Works
- Step 1: Download the prebuilt Excel template featuring data from Xinjiang Machinery Research Institute Co., Ltd. (300159SZ).
- Step 2: Navigate through the pre-filled sheets to familiarize yourself with the essential metrics.
- Step 3: Modify forecasts and assumptions in the editable yellow cells (WACC, growth rates, margins).
- Step 4: Instantly view the updated calculations, including Xinjiang Machinery's intrinsic value.
- Step 5: Use the outputs to make strategic investment choices or create comprehensive reports.
Why Opt for This Calculator?
- Reliable Data: Up-to-date financials from Xinjiang Machinery Research Institute Co., Ltd. provide trustworthy valuation outcomes.
- Customizable Features: Tailor key inputs such as growth rates, WACC, and tax rates according to your specific forecasts.
- Efficiency Boost: Built-in calculations save you the hassle of starting from scratch.
- Professional-Quality Tool: Tailored for investors, analysts, and consultants in the machinery sector.
- User-Friendly Design: An intuitive interface and clear step-by-step guidance ensure ease of use for everyone.
Who Should Utilize This Product?
- Investors: Assess the valuation of Xinjiang Machinery Research Institute Co., Ltd. (300159SZ) prior to making investment decisions.
- CFOs and Financial Analysts: Optimize valuation processes and evaluate financial forecasts.
- Startup Founders: Discover the valuation strategies of established companies like Xinjiang Machinery Research Institute Co., Ltd. (300159SZ).
- Consultants: Provide expert valuation reports for clients featuring Xinjiang Machinery Research Institute Co., Ltd. (300159SZ).
- Students and Educators: Leverage real-world examples to practice and teach valuation methods with reference to Xinjiang Machinery Research Institute Co., Ltd. (300159SZ).
Contents of the Template
- Historical Data: Overview of Xinjiang Machinery Research Institute Co., Ltd.’s (300159SZ) previous financial performance and standard projections.
- DCF and Levered DCF Models: Comprehensive templates to assess the intrinsic value of Xinjiang Machinery Research Institute Co., Ltd. (300159SZ).
- WACC Sheet: Ready-to-use calculations for the Weighted Average Cost of Capital.
- Editable Inputs: Customize important parameters including growth rates, EBITDA percentages, and CAPEX forecasts.
- Quarterly and Annual Statements: A thorough analysis of Xinjiang Machinery Research Institute Co., Ltd.’s (300159SZ) financial documentation.
- Interactive Dashboard: Dynamically visualize valuation outcomes and future projections.
Disclaimer
All information, articles, and product details provided on this website are for general informational and educational purposes only. We do not claim any ownership over, nor do we intend to infringe upon, any trademarks, copyrights, logos, brand names, or other intellectual property mentioned or depicted on this site. Such intellectual property remains the property of its respective owners, and any references here are made solely for identification or informational purposes, without implying any affiliation, endorsement, or partnership.
We make no representations or warranties, express or implied, regarding the accuracy, completeness, or suitability of any content or products presented. Nothing on this website should be construed as legal, tax, investment, financial, medical, or other professional advice. In addition, no part of this site—including articles or product references—constitutes a solicitation, recommendation, endorsement, advertisement, or offer to buy or sell any securities, franchises, or other financial instruments, particularly in jurisdictions where such activity would be unlawful.
All content is of a general nature and may not address the specific circumstances of any individual or entity. It is not a substitute for professional advice or services. Any actions you take based on the information provided here are strictly at your own risk. You accept full responsibility for any decisions or outcomes arising from your use of this website and agree to release us from any liability in connection with your use of, or reliance upon, the content or products found herein.