
|
Hybio Pharmaceutical Co., Ltd. (300199.SZ) DCF -Bewertung |
Fully Editable: Tailor To Your Needs In Excel Or Sheets
Professional Design: Trusted, Industry-Standard Templates
Investor-Approved Valuation Models
MAC/PC Compatible, Fully Unlocked
No Expertise Is Needed; Easy To Follow
Hybio Pharmaceutical Co., Ltd. (300199.SZ) Bundle
Entdecken Sie das finanzielle Potenzial von Hybio Pharmaceutical Co., Ltd. (300199SZ) mit unserem benutzerfreundlichen DCF-Taschenrechner! Geben Sie Ihre Projektionen für Wachstum, Margen und Kosten ein, um den inneren Wert von Hybio Pharmaceutical Co., Ltd. (300199SZ) zu berechnen, und verfeinern Sie Ihren Investitionsansatz.
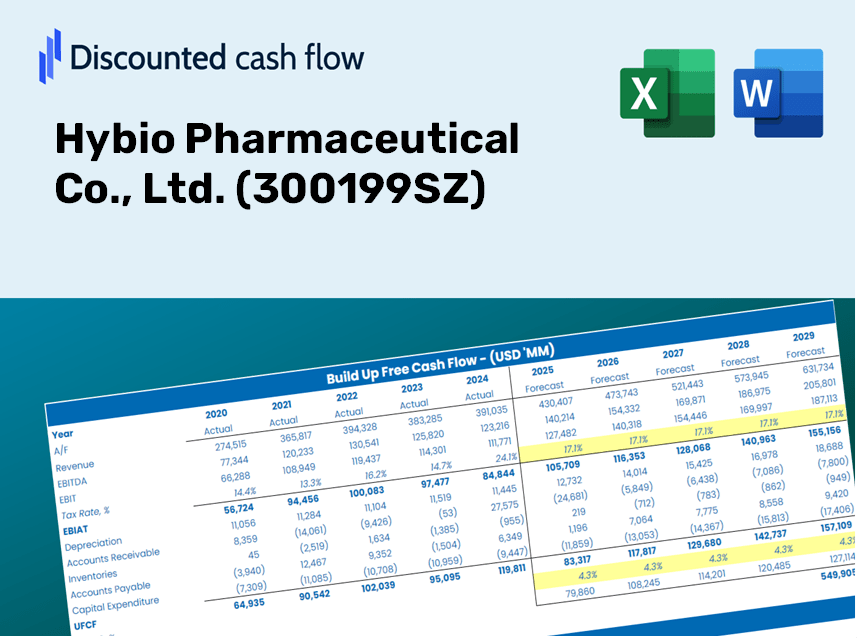
Discounted Cash Flow (DCF) - (USD MM)
| Year | AY1 2020 |
AY2 2021 |
AY3 2022 |
AY4 2023 |
AY5 2024 |
FY1 2025 |
FY2 2026 |
FY3 2027 |
FY4 2028 |
FY5 2029 |
|---|---|---|---|---|---|---|---|---|---|---|
| Revenue | 721.7 | 736.0 | 704.3 | 431.4 | 590.2 | 583.9 | 577.7 | 571.5 | 565.4 | 559.4 |
| Revenue Growth, % | 0 | 1.97 | -4.3 | -38.75 | 36.82 | -1.07 | -1.07 | -1.07 | -1.07 | -1.07 |
| EBITDA | -440.7 | -144.9 | -52.6 | -222.6 | 113.5 | -140.8 | -139.3 | -137.9 | -136.4 | -134.9 |
| EBITDA, % | -61.06 | -19.69 | -7.47 | -51.61 | 19.23 | -24.12 | -24.12 | -24.12 | -24.12 | -24.12 |
| Depreciation | 104.5 | 125.3 | 129.5 | 148.8 | 145.9 | 127.4 | 126.1 | 124.7 | 123.4 | 122.1 |
| Depreciation, % | 14.49 | 17.03 | 18.39 | 34.49 | 24.73 | 21.82 | 21.82 | 21.82 | 21.82 | 21.82 |
| EBIT | -545.3 | -270.3 | -182.1 | -371.4 | -32.4 | -268.3 | -265.4 | -262.6 | -259.8 | -257.0 |
| EBIT, % | -75.55 | -36.72 | -25.86 | -86.1 | -5.49 | -45.94 | -45.94 | -45.94 | -45.94 | -45.94 |
| Total Cash | 451.6 | 616.6 | 266.8 | 344.0 | 96.0 | 327.3 | 323.8 | 320.3 | 316.9 | 313.6 |
| Total Cash, percent | .0 | .0 | .0 | .0 | .0 | .0 | .0 | .0 | .0 | .0 |
| Account Receivables | 332.0 | 334.5 | 318.1 | 152.1 | 104.9 | 221.5 | 219.1 | 216.8 | 214.5 | 212.2 |
| Account Receivables, % | 46 | 45.45 | 45.16 | 35.27 | 17.77 | 37.93 | 37.93 | 37.93 | 37.93 | 37.93 |
| Inventories | 186.8 | 157.1 | 190.0 | 152.6 | 238.6 | 175.2 | 173.3 | 171.5 | 169.6 | 167.8 |
| Inventories, % | 25.88 | 21.35 | 26.97 | 35.37 | 40.43 | 30 | 30 | 30 | 30 | 30 |
| Accounts Payable | 125.5 | 90.7 | 129.1 | 108.5 | 218.3 | 128.7 | 127.3 | 125.9 | 124.6 | 123.3 |
| Accounts Payable, % | 17.39 | 12.33 | 18.32 | 25.15 | 36.98 | 22.03 | 22.03 | 22.03 | 22.03 | 22.03 |
| Capital Expenditure | -243.7 | -199.0 | -189.8 | -81.8 | -115.8 | -147.5 | -146.0 | -144.4 | -142.9 | -141.3 |
| Capital Expenditure, % | -33.76 | -27.04 | -26.95 | -18.95 | -19.63 | -25.27 | -25.27 | -25.27 | -25.27 | -25.27 |
| Tax Rate, % | -6.92 | -6.92 | -6.92 | -6.92 | -6.92 | -6.92 | -6.92 | -6.92 | -6.92 | -6.92 |
| EBITAT | -564.9 | -247.2 | -181.0 | -373.4 | -34.7 | -263.4 | -260.6 | -257.8 | -255.0 | -252.3 |
| Depreciation | ||||||||||
| Changes in Account Receivables | ||||||||||
| Changes in Inventories | ||||||||||
| Changes in Accounts Payable | ||||||||||
| Capital Expenditure | ||||||||||
| UFCF | -1,097.3 | -328.5 | -219.4 | -123.7 | 66.4 | -426.2 | -277.6 | -274.6 | -271.7 | -268.8 |
| WACC, % | 6.9 | 6.85 | 6.89 | 6.9 | 6.9 | 6.89 | 6.89 | 6.89 | 6.89 | 6.89 |
| PV UFCF | ||||||||||
| SUM PV UFCF | -1,267.5 | |||||||||
| Long Term Growth Rate, % | 2.00 | |||||||||
| Free cash flow (T + 1) | -274 | |||||||||
| Terminal Value | -5,612 | |||||||||
| Present Terminal Value | -4,023 | |||||||||
| Enterprise Value | -5,290 | |||||||||
| Net Debt | 1,405 | |||||||||
| Equity Value | -6,695 | |||||||||
| Diluted Shares Outstanding, MM | 868 | |||||||||
| Equity Value Per Share | -7.71 |
Benefits You'll Enjoy
- Adjustable Forecast Inputs: Seamlessly modify key assumptions (growth %, profit margins, discount rates) to develop various scenarios.
- Real-Time Financial Data: Pre-filled financial metrics from Hybio Pharmaceutical Co., Ltd. (300199SZ) to expedite your analysis.
- Automated DCF Calculations: The template generates Net Present Value (NPV) and intrinsic value calculations effortlessly.
- Tailored and Professional Design: A sleek Excel model that caters to your specific valuation requirements.
- Designed for Analysts and Investors: Perfect for testing forecasts, validating investment strategies, and enhancing efficiency.
Key Features of Hybio Pharmaceutical Co., Ltd. (300199SZ)
- Comprehensive Financial Data: Gain access to reliable historical financials and future performance projections.
- Tailored Forecast Parameters: Modify yellow-highlighted cells to adjust metrics such as WACC, growth rates, and profit margins.
- Automated Financial Calculations: Instant updates for DCF, Net Present Value (NPV), and cash flow assessments.
- Interactive Visualization Dashboard: User-friendly charts and summaries to help you interpret your valuation outcomes.
- Designed for All Skill Levels: An intuitive layout catering to investors, CFOs, and consultants, whether seasoned or new.
How It Works
- Step 1: Download the prebuilt Excel template containing Hybio Pharmaceutical’s data.
- Step 2: Review the pre-filled sheets to familiarize yourself with the essential metrics.
- Step 3: Modify forecasts and assumptions in the editable yellow cells (WACC, growth, margins).
- Step 4: Instantly see the recalculated results, including Hybio Pharmaceutical's intrinsic value.
- Step 5: Make well-informed investment decisions or create reports based on the outputs.
Why Choose Hybio's Calculator?
- Time Efficient: Skip the hassle of building a DCF model from the ground up – it’s ready for immediate use.
- Enhanced Accuracy: Dependable financial data and formulas minimize valuation errors.
- Completely Customizable: Adjust the model to align with your specific assumptions and projections.
- Simple to Understand: Intuitive charts and outputs facilitate straightforward analysis of results.
- Endorsed by Professionals: Crafted for experts who prioritize both precision and user-friendliness.
Who Can Benefit from Our Product?
- Pharmaceutical Students: Explore drug development processes and apply learnings to actual case studies.
- Researchers: Integrate advanced models into your studies or projects related to pharmaceutical innovations.
- Investors: Validate your hypotheses and assess the valuation prospects of Hybio Pharmaceutical (300199SZ).
- Market Analysts: Enhance your efficiency with a ready-to-use, customizable financial model tailored for the pharmaceutical sector.
- Entrepreneurs: Discover how leading pharmaceutical companies like Hybio are evaluated in the market.
What the Template Contains
- Historical Data: Contains Hybio Pharmaceutical Co., Ltd. (300199SZ)'s previous financial performance and baseline forecasts.
- DCF and Levered DCF Models: Comprehensive templates for calculating the intrinsic value of Hybio Pharmaceutical Co., Ltd. (300199SZ).
- WACC Sheet: Pre-configured calculations for the Weighted Average Cost of Capital.
- Editable Inputs: Customize key drivers such as growth rates, EBITDA margins, and capital expenditure assumptions.
- Quarterly and Annual Statements: Detailed breakdown of Hybio Pharmaceutical Co., Ltd. (300199SZ)'s financial statements.
- Interactive Dashboard: Dynamically visualize valuation outcomes and forecasts.
Disclaimer
All information, articles, and product details provided on this website are for general informational and educational purposes only. We do not claim any ownership over, nor do we intend to infringe upon, any trademarks, copyrights, logos, brand names, or other intellectual property mentioned or depicted on this site. Such intellectual property remains the property of its respective owners, and any references here are made solely for identification or informational purposes, without implying any affiliation, endorsement, or partnership.
We make no representations or warranties, express or implied, regarding the accuracy, completeness, or suitability of any content or products presented. Nothing on this website should be construed as legal, tax, investment, financial, medical, or other professional advice. In addition, no part of this site—including articles or product references—constitutes a solicitation, recommendation, endorsement, advertisement, or offer to buy or sell any securities, franchises, or other financial instruments, particularly in jurisdictions where such activity would be unlawful.
All content is of a general nature and may not address the specific circumstances of any individual or entity. It is not a substitute for professional advice or services. Any actions you take based on the information provided here are strictly at your own risk. You accept full responsibility for any decisions or outcomes arising from your use of this website and agree to release us from any liability in connection with your use of, or reliance upon, the content or products found herein.