
|
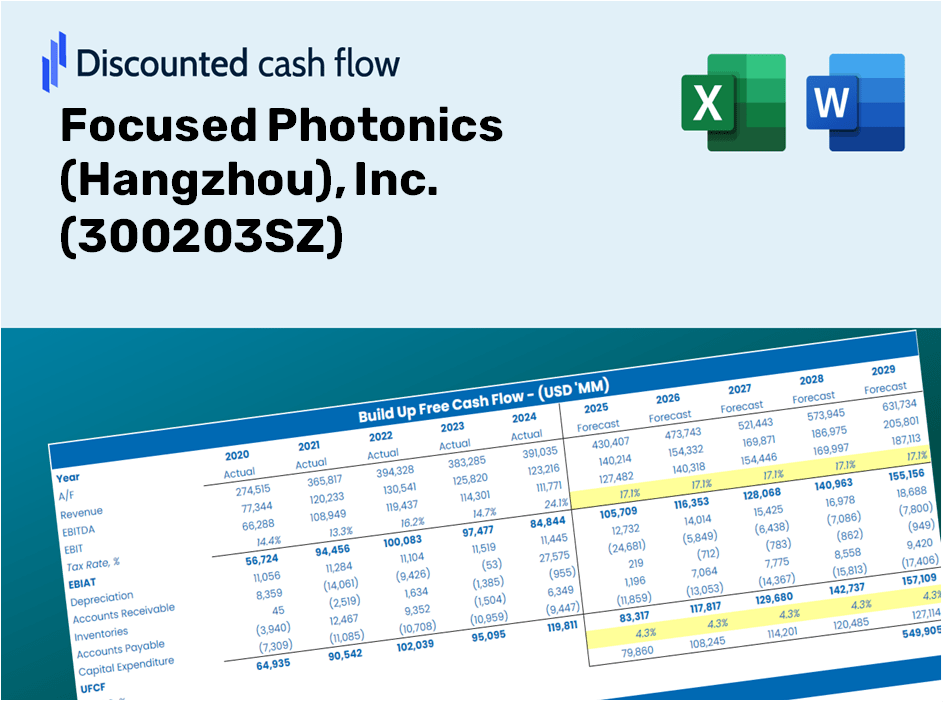
Focused Photonics, Inc. (300203.SZ) DCF -Bewertung |
Fully Editable: Tailor To Your Needs In Excel Or Sheets
Professional Design: Trusted, Industry-Standard Templates
Investor-Approved Valuation Models
MAC/PC Compatible, Fully Unlocked
No Expertise Is Needed; Easy To Follow
Focused Photonics (Hangzhou), Inc. (300203.SZ) Bundle
Entdecken Sie das wahre Potenzial der fokussierten Photonik (Hangzhou), Inc. (300203SZ) mit unserem fortschrittlichen DCF -Taschenrechner! Passen Sie die wichtigsten Annahmen an, erkunden Sie verschiedene Szenarien und bewerten Sie, wie unterschiedliche Änderungen die Bewertung der fokussierten Photonik (Hangzhou), Inc. (300203SZ) beeinflussen - alles innerhalb einer einzigen Excel -Vorlage.
Discounted Cash Flow (DCF) - (USD MM)
| Year | AY1 2020 |
AY2 2021 |
AY3 2022 |
AY4 2023 |
AY5 2024 |
FY1 2025 |
FY2 2026 |
FY3 2027 |
FY4 2028 |
FY5 2029 |
|---|---|---|---|---|---|---|---|---|---|---|
| Revenue | 4,101.2 | 3,750.5 | 3,450.6 | 3,181.6 | 3,613.6 | 3,516.3 | 3,421.7 | 3,329.6 | 3,240.0 | 3,152.8 |
| Revenue Growth, % | 0 | -8.55 | -8 | -7.8 | 13.58 | -2.69 | -2.69 | -2.69 | -2.69 | -2.69 |
| EBITDA | 332.9 | -52.9 | -120.5 | -161.1 | 466.3 | 77.7 | 75.6 | 73.6 | 71.6 | 69.7 |
| EBITDA, % | 8.12 | -1.41 | -3.49 | -5.06 | 12.9 | 2.21 | 2.21 | 2.21 | 2.21 | 2.21 |
| Depreciation | 106.6 | 114.9 | 118.3 | 139.0 | 160.8 | 125.9 | 122.6 | 119.3 | 116.0 | 112.9 |
| Depreciation, % | 2.6 | 3.06 | 3.43 | 4.37 | 4.45 | 3.58 | 3.58 | 3.58 | 3.58 | 3.58 |
| EBIT | 226.4 | -167.7 | -238.9 | -300.1 | 305.5 | -48.2 | -46.9 | -45.6 | -44.4 | -43.2 |
| EBIT, % | 5.52 | -4.47 | -6.92 | -9.43 | 8.45 | -1.37 | -1.37 | -1.37 | -1.37 | -1.37 |
| Total Cash | 1,479.2 | 1,421.5 | 1,459.2 | 1,255.9 | 1,410.9 | 1,369.8 | 1,332.9 | 1,297.1 | 1,262.2 | 1,228.2 |
| Total Cash, percent | .0 | .0 | .0 | .0 | .0 | .0 | .0 | .0 | .0 | .0 |
| Account Receivables | 2,010.5 | 1,834.8 | 1,398.1 | 1,232.8 | 1,183.9 | 1,476.7 | 1,436.9 | 1,398.3 | 1,360.6 | 1,324.0 |
| Account Receivables, % | 49.02 | 48.92 | 40.52 | 38.75 | 32.76 | 41.99 | 41.99 | 41.99 | 41.99 | 41.99 |
| Inventories | 1,175.6 | 1,358.2 | 1,349.9 | 1,373.8 | 1,295.7 | 1,287.2 | 1,252.6 | 1,218.8 | 1,186.0 | 1,154.1 |
| Inventories, % | 28.66 | 36.21 | 39.12 | 43.18 | 35.86 | 36.61 | 36.61 | 36.61 | 36.61 | 36.61 |
| Accounts Payable | 605.6 | 883.3 | 1,279.5 | 1,183.6 | 1,027.7 | 991.9 | 965.2 | 939.2 | 913.9 | 889.3 |
| Accounts Payable, % | 14.77 | 23.55 | 37.08 | 37.2 | 28.44 | 28.21 | 28.21 | 28.21 | 28.21 | 28.21 |
| Capital Expenditure | -626.8 | -168.7 | -131.9 | -119.6 | -110.0 | -213.9 | -208.1 | -202.5 | -197.0 | -191.7 |
| Capital Expenditure, % | -15.28 | -4.5 | -3.82 | -3.76 | -3.05 | -6.08 | -6.08 | -6.08 | -6.08 | -6.08 |
| Tax Rate, % | 20.54 | 20.54 | 20.54 | 20.54 | 20.54 | 20.54 | 20.54 | 20.54 | 20.54 | 20.54 |
| EBITAT | 197.7 | -135.8 | -177.6 | -259.0 | 242.8 | -39.4 | -38.3 | -37.3 | -36.3 | -35.3 |
| Depreciation | ||||||||||
| Changes in Account Receivables | ||||||||||
| Changes in Inventories | ||||||||||
| Changes in Accounts Payable | ||||||||||
| Capital Expenditure | ||||||||||
| UFCF | -2,903.1 | 81.1 | 650.0 | -194.0 | 264.6 | -447.4 | -76.2 | -74.1 | -72.1 | -70.2 |
| WACC, % | 4.7 | 4.6 | 4.5 | 4.69 | 4.58 | 4.61 | 4.61 | 4.61 | 4.61 | 4.61 |
| PV UFCF | ||||||||||
| SUM PV UFCF | -678.3 | |||||||||
| Long Term Growth Rate, % | 2.00 | |||||||||
| Free cash flow (T + 1) | -72 | |||||||||
| Terminal Value | -2,739 | |||||||||
| Present Terminal Value | -2,186 | |||||||||
| Enterprise Value | -2,864 | |||||||||
| Net Debt | 1,468 | |||||||||
| Equity Value | -4,333 | |||||||||
| Diluted Shares Outstanding, MM | 450 | |||||||||
| Equity Value Per Share | -9.63 |
What You Will Receive
- Customizable Forecast Inputs: Easily modify assumptions (growth %, margins, WACC) to explore various scenarios.
- Industry Data: Focused Photonics (Hangzhou), Inc. (300203SZ) financial data pre-loaded to kickstart your analysis.
- Automated DCF Outputs: The template computes Net Present Value (NPV) and intrinsic value automatically.
- Professional and Adaptable: A refined Excel model tailored to meet your valuation requirements.
- Designed for Analysts and Investors: Perfect for evaluating projections, validating strategies, and enhancing efficiency.
Key Features
- Advanced DCF Calculator: Features comprehensive unlevered and levered DCF valuation models tailored for Focused Photonics (Hangzhou), Inc. (300203SZ).
- WACC Calculator: Comes with a pre-designed Weighted Average Cost of Capital sheet that allows for customizable inputs specific to Focused Photonics (Hangzhou), Inc. (300203SZ).
- Editable Forecast Assumptions: Easily adjust growth rates, capital expenditures, and discount rates to reflect the unique metrics of Focused Photonics (Hangzhou), Inc. (300203SZ).
- Built-In Financial Ratios: Evaluate profitability, leverage, and efficiency ratios pertinent to Focused Photonics (Hangzhou), Inc. (300203SZ).
- Dashboard and Charts: Visual representations provide a summary of essential valuation metrics for straightforward analysis of Focused Photonics (Hangzhou), Inc. (300203SZ).
How It Works
- Step 1: Download the prebuilt Excel template containing Focused Photonics (Hangzhou), Inc.'s [300203SZ] data.
- Step 2: Navigate through the pre-filled sheets to familiarize yourself with the essential metrics.
- Step 3: Modify forecasts and assumptions in the editable yellow cells (WACC, growth, margins).
- Step 4: Instantly see recalculated outcomes, including the intrinsic value of Focused Photonics (Hangzhou), Inc. [300203SZ].
- Step 5: Utilize the outputs to make informed investment choices or create detailed reports.
Why Opt for Focused Photonics (300203SZ) Calculator?
- Designed for Industry Experts: A sophisticated tool tailored for analysts, CFOs, and consultants.
- Accurate Data Integration: Historical and projected financial information for Focused Photonics preloaded for precision.
- Versatile Scenario Simulations: Effortlessly test various forecasts and assumptions.
- Detailed Outputs: Automatically computes intrinsic value, NPV, and other essential metrics.
- User-Friendly Interface: Comprehensive step-by-step guidance simplifies the process.
Who Should Use This Product?
- Optics Students: Master the principles of photonics and apply them to real-world scenarios.
- Researchers: Integrate cutting-edge photonic models into your studies and investigations.
- Investors: Validate your financial assumptions and analyze the performance metrics for Focused Photonics (300203SZ).
- Industry Analysts: Enhance your analysis efficiency with a ready-to-use, customizable photonics model.
- Entrepreneurs: Understand how leading companies in photonics, like Focused Photonics, are evaluated in the market.
What the Template Includes
- Historical Data: Contains Focused Photonics’ previous financials and foundational forecasts.
- DCF and Levered DCF Models: Comprehensive templates for determining Focused Photonics’ intrinsic value.
- WACC Sheet: Pre-structured calculations for the Weighted Average Cost of Capital.
- Editable Inputs: Customize key drivers such as growth rates, EBITDA percentages, and CAPEX assumptions.
- Quarterly and Annual Statements: A thorough analysis of Focused Photonics’ financials.
- Interactive Dashboard: Dynamically visualize valuation results and forecasts.
Disclaimer
All information, articles, and product details provided on this website are for general informational and educational purposes only. We do not claim any ownership over, nor do we intend to infringe upon, any trademarks, copyrights, logos, brand names, or other intellectual property mentioned or depicted on this site. Such intellectual property remains the property of its respective owners, and any references here are made solely for identification or informational purposes, without implying any affiliation, endorsement, or partnership.
We make no representations or warranties, express or implied, regarding the accuracy, completeness, or suitability of any content or products presented. Nothing on this website should be construed as legal, tax, investment, financial, medical, or other professional advice. In addition, no part of this site—including articles or product references—constitutes a solicitation, recommendation, endorsement, advertisement, or offer to buy or sell any securities, franchises, or other financial instruments, particularly in jurisdictions where such activity would be unlawful.
All content is of a general nature and may not address the specific circumstances of any individual or entity. It is not a substitute for professional advice or services. Any actions you take based on the information provided here are strictly at your own risk. You accept full responsibility for any decisions or outcomes arising from your use of this website and agree to release us from any liability in connection with your use of, or reliance upon, the content or products found herein.