
|
Newcapec Electronics Co., Ltd. (300248.SZ) DCF -Bewertung |
Fully Editable: Tailor To Your Needs In Excel Or Sheets
Professional Design: Trusted, Industry-Standard Templates
Investor-Approved Valuation Models
MAC/PC Compatible, Fully Unlocked
No Expertise Is Needed; Easy To Follow
Newcapec Electronics Co., Ltd. (300248.SZ) Bundle
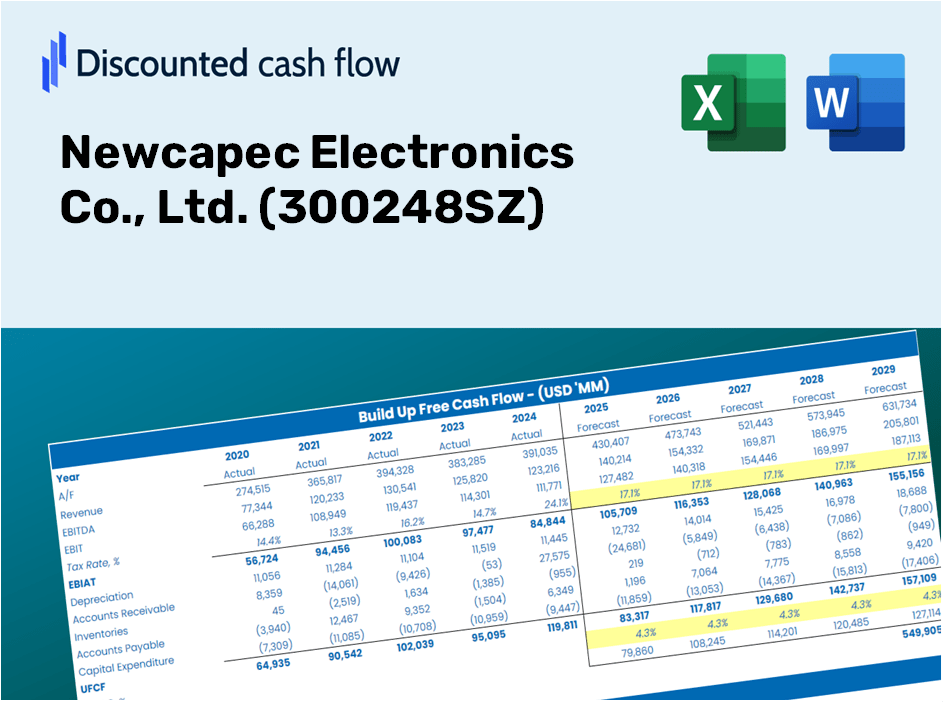
Mit unserem (300248SZ) DCF-Taschenrechner können Sie NewCapec Electronics Co., Ltd. bewerten, indem Sie reale Finanzdaten bewerten und vollständige Flexibilität bieten, um alle wesentlichen Parameter für erweiterte Projektionen zu ändern.
Discounted Cash Flow (DCF) - (USD MM)
| Year | AY1 2020 |
AY2 2021 |
AY3 2022 |
AY4 2023 |
AY5 2024 |
FY1 2025 |
FY2 2026 |
FY3 2027 |
FY4 2028 |
FY5 2029 |
|---|---|---|---|---|---|---|---|---|---|---|
| Revenue | 939.3 | 1,016.7 | 1,069.7 | 1,061.4 | 984.2 | 997.5 | 1,010.9 | 1,024.6 | 1,038.4 | 1,052.4 |
| Revenue Growth, % | 0 | 8.23 | 5.22 | -0.77613 | -7.27 | 1.35 | 1.35 | 1.35 | 1.35 | 1.35 |
| EBITDA | 245.8 | 240.4 | 200.2 | 199.7 | 240.5 | 223.0 | 226.0 | 229.1 | 232.1 | 235.3 |
| EBITDA, % | 26.17 | 23.64 | 18.72 | 18.81 | 24.44 | 22.36 | 22.36 | 22.36 | 22.36 | 22.36 |
| Depreciation | 36.1 | 50.9 | 68.5 | 85.6 | 93.6 | 65.5 | 66.4 | 67.3 | 68.2 | 69.1 |
| Depreciation, % | 3.84 | 5.01 | 6.4 | 8.06 | 9.51 | 6.57 | 6.57 | 6.57 | 6.57 | 6.57 |
| EBIT | 209.7 | 189.4 | 131.7 | 114.1 | 146.9 | 157.5 | 159.6 | 161.8 | 164.0 | 166.2 |
| EBIT, % | 22.33 | 18.63 | 12.31 | 10.75 | 14.92 | 15.79 | 15.79 | 15.79 | 15.79 | 15.79 |
| Total Cash | 607.7 | 722.2 | 461.0 | 426.4 | 389.9 | 515.9 | 522.9 | 529.9 | 537.1 | 544.3 |
| Total Cash, percent | .0 | .0 | .0 | .0 | .0 | .0 | .0 | .0 | .0 | .0 |
| Account Receivables | 553.2 | 624.1 | 698.9 | 755.8 | 741.7 | 662.7 | 671.6 | 680.7 | 689.9 | 699.2 |
| Account Receivables, % | 58.9 | 61.39 | 65.34 | 71.21 | 75.36 | 66.44 | 66.44 | 66.44 | 66.44 | 66.44 |
| Inventories | 255.2 | 298.9 | 272.4 | 237.5 | 161.1 | 240.9 | 244.2 | 247.5 | 250.8 | 254.2 |
| Inventories, % | 27.17 | 29.4 | 25.47 | 22.37 | 16.37 | 24.15 | 24.15 | 24.15 | 24.15 | 24.15 |
| Accounts Payable | 221.9 | 241.1 | 231.0 | 225.1 | 205.6 | 221.5 | 224.5 | 227.5 | 230.6 | 233.7 |
| Accounts Payable, % | 23.62 | 23.71 | 21.59 | 21.21 | 20.89 | 22.2 | 22.2 | 22.2 | 22.2 | 22.2 |
| Capital Expenditure | -82.3 | -95.6 | -164.5 | -167.2 | -165.8 | -131.9 | -133.7 | -135.5 | -137.4 | -139.2 |
| Capital Expenditure, % | -8.76 | -9.4 | -15.38 | -15.75 | -16.85 | -13.23 | -13.23 | -13.23 | -13.23 | -13.23 |
| Tax Rate, % | 13.09 | 13.09 | 13.09 | 13.09 | 13.09 | 13.09 | 13.09 | 13.09 | 13.09 | 13.09 |
| EBITAT | 183.9 | 162.9 | 115.8 | 110.4 | 127.6 | 140.2 | 142.1 | 144.1 | 146.0 | 148.0 |
| Depreciation | ||||||||||
| Changes in Account Receivables | ||||||||||
| Changes in Inventories | ||||||||||
| Changes in Accounts Payable | ||||||||||
| Capital Expenditure | ||||||||||
| UFCF | -448.9 | 22.9 | -38.8 | 1.1 | 126.4 | 88.8 | 65.6 | 66.5 | 67.4 | 68.3 |
| WACC, % | 4.51 | 4.51 | 4.51 | 4.51 | 4.51 | 4.51 | 4.51 | 4.51 | 4.51 | 4.51 |
| PV UFCF | ||||||||||
| SUM PV UFCF | 314.5 | |||||||||
| Long Term Growth Rate, % | 3.50 | |||||||||
| Free cash flow (T + 1) | 71 | |||||||||
| Terminal Value | 7,002 | |||||||||
| Present Terminal Value | 5,616 | |||||||||
| Enterprise Value | 5,931 | |||||||||
| Net Debt | -275 | |||||||||
| Equity Value | 6,206 | |||||||||
| Diluted Shares Outstanding, MM | 476 | |||||||||
| Equity Value Per Share | 13.03 |
Benefits You Will Receive
- Pre-Built Financial Model: Leverage Newcapec Electronics’ historical data for accurate DCF valuation.
- Comprehensive Forecast Control: Modify revenue growth rates, profit margins, WACC, and other essential metrics.
- Real-Time Calculations: Instant updates allow you to view results immediately as you adjust inputs.
- Professional-Grade Template: A polished Excel file crafted for high-quality valuation presentations.
- Flexible and Reusable: Designed for customization, enabling repeated use for in-depth forecasting.
Key Features
- Customizable Forecast Inputs: Adjust essential metrics such as revenue growth, EBITDA margin, and capital expenditures.
- Instant DCF Valuation: Automatically computes intrinsic value, NPV, and various financial outputs in real-time.
- High-Precision Accuracy: Leverages Newcapec Electronics' actual financial data for dependable valuation results.
- Effortless Scenario Analysis: Easily evaluate different assumptions and analyze outcomes side by side.
- Efficiency Booster: Streamlines the valuation process, removing the need for complex model creation from the ground up.
How It Works
- Download the Template: Gain instant access to the Excel-based Newcapec Electronics DCF Calculator.
- Input Your Assumptions: Modify the yellow-highlighted cells for growth rates, WACC, margins, and other parameters.
- Instant Calculations: The model instantly recalculates Newcapec Electronics' intrinsic value.
- Test Scenarios: Experiment with different assumptions to see how valuations might change.
- Analyze and Decide: Utilize the results to inform your investment or financial strategies.
Why Choose This Calculator for Newcapec Electronics Co., Ltd. (300248SZ)?
- User-Friendly Interface: Crafted for both novices and seasoned professionals.
- Customizable Inputs: Effortlessly adjust parameters to suit your analysis needs.
- Instantaneous Updates: Witness real-time adjustments to Newcapec Electronics' valuation as you modify inputs.
- Preloaded Data: Comes with Newcapec's current financial information for swift evaluation.
- Relied Upon by Experts: Favored by investors and analysts for making well-informed choices.
Who Can Benefit from Newcapec Electronics Co., Ltd. (300248SZ)?
- Investors: Make informed investment choices with a sophisticated valuation tool tailored for Newcapec Electronics.
- Financial Analysts: Streamline your analysis with a customizable DCF model specifically designed for the electronics sector.
- Consultants: Effortlessly modify the template for impactful client presentations or detailed reports on Newcapec Electronics.
- Finance Enthusiasts: Enhance your grasp of valuation methodologies through practical examples from Newcapec Electronics.
- Educators and Students: Leverage this tool as a hands-on resource in finance courses focused on electronics companies.
Contents of the Template
- Preloaded NC Electronics Data: Historical and projected financials, including revenue, EBIT, and capital expenditures.
- DCF and WACC Models: Advanced sheets designed for calculating intrinsic value and Weighted Average Cost of Capital.
- Editable Inputs: Cells highlighted in yellow for modifying revenue growth, tax rates, and discount rates.
- Financial Statements: Detailed annual and quarterly financial reports for in-depth analysis.
- Key Ratios: Ratios related to profitability, leverage, and efficiency for performance assessment.
- Dashboard and Charts: Visual representations of valuation results and underlying assumptions.
Disclaimer
All information, articles, and product details provided on this website are for general informational and educational purposes only. We do not claim any ownership over, nor do we intend to infringe upon, any trademarks, copyrights, logos, brand names, or other intellectual property mentioned or depicted on this site. Such intellectual property remains the property of its respective owners, and any references here are made solely for identification or informational purposes, without implying any affiliation, endorsement, or partnership.
We make no representations or warranties, express or implied, regarding the accuracy, completeness, or suitability of any content or products presented. Nothing on this website should be construed as legal, tax, investment, financial, medical, or other professional advice. In addition, no part of this site—including articles or product references—constitutes a solicitation, recommendation, endorsement, advertisement, or offer to buy or sell any securities, franchises, or other financial instruments, particularly in jurisdictions where such activity would be unlawful.
All content is of a general nature and may not address the specific circumstances of any individual or entity. It is not a substitute for professional advice or services. Any actions you take based on the information provided here are strictly at your own risk. You accept full responsibility for any decisions or outcomes arising from your use of this website and agree to release us from any liability in connection with your use of, or reliance upon, the content or products found herein.