
|
Leyard Optoelektronische Co., Ltd. (300296.SZ) DCF -Bewertung |
Fully Editable: Tailor To Your Needs In Excel Or Sheets
Professional Design: Trusted, Industry-Standard Templates
Investor-Approved Valuation Models
MAC/PC Compatible, Fully Unlocked
No Expertise Is Needed; Easy To Follow
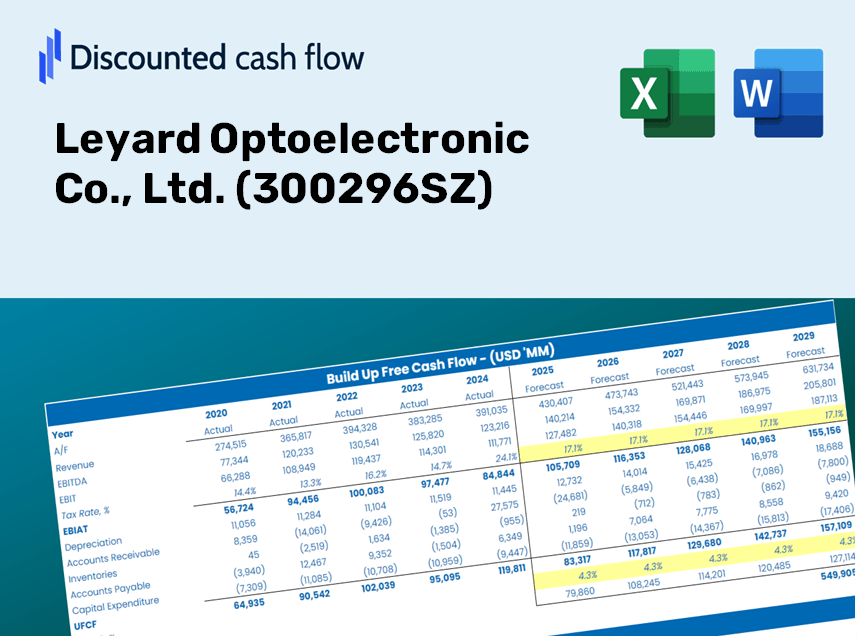
Leyard Optoelectronic Co., Ltd. (300296.SZ) Bundle
Als Anleger oder Analyst ist der DCF-Rechner von Leyard Optoelectronic Co., Ltd. (300296SZ) Ihre Anlaufstelle für eine genaue Bewertung. Ausgestattet mit echten Daten von Leyard können Sie problemlos Prognosen anpassen und die Auswirkungen sofort beobachten.
Discounted Cash Flow (DCF) - (USD MM)
| Year | AY1 2020 |
AY2 2021 |
AY3 2022 |
AY4 2023 |
AY5 2024 |
FY1 2025 |
FY2 2026 |
FY3 2027 |
FY4 2028 |
FY5 2029 |
|---|---|---|---|---|---|---|---|---|---|---|
| Revenue | 6,633.7 | 8,852.4 | 8,153.6 | 7,615.0 | 7,149.7 | 7,379.1 | 7,615.9 | 7,860.3 | 8,112.6 | 8,372.9 |
| Revenue Growth, % | 0 | 33.45 | -7.89 | -6.61 | -6.11 | 3.21 | 3.21 | 3.21 | 3.21 | 3.21 |
| EBITDA | 717.3 | 1,084.4 | 751.9 | 544.0 | 64.7 | 595.2 | 614.3 | 634.1 | 654.4 | 675.4 |
| EBITDA, % | 10.81 | 12.25 | 9.22 | 7.14 | 0.90437 | 8.07 | 8.07 | 8.07 | 8.07 | 8.07 |
| Depreciation | 177.4 | 162.3 | 198.8 | 232.7 | 217.0 | 192.4 | 198.6 | 205.0 | 211.5 | 218.3 |
| Depreciation, % | 2.67 | 1.83 | 2.44 | 3.06 | 3.04 | 2.61 | 2.61 | 2.61 | 2.61 | 2.61 |
| EBIT | 539.9 | 922.2 | 553.1 | 311.3 | -152.4 | 402.8 | 415.8 | 429.1 | 442.9 | 457.1 |
| EBIT, % | 8.14 | 10.42 | 6.78 | 4.09 | -2.13 | 5.46 | 5.46 | 5.46 | 5.46 | 5.46 |
| Total Cash | 2,619.9 | 2,366.7 | 2,120.4 | 2,397.3 | 2,655.2 | 2,373.9 | 2,450.1 | 2,528.7 | 2,609.8 | 2,693.6 |
| Total Cash, percent | .0 | .0 | .0 | .0 | .0 | .0 | .0 | .0 | .0 | .0 |
| Account Receivables | 4,639.8 | 5,325.6 | 5,160.6 | 5,144.5 | 4,648.7 | 4,810.8 | 4,965.2 | 5,124.5 | 5,288.9 | 5,458.7 |
| Account Receivables, % | 69.94 | 60.16 | 63.29 | 67.56 | 65.02 | 65.19 | 65.19 | 65.19 | 65.19 | 65.19 |
| Inventories | 2,578.5 | 3,610.6 | 3,285.5 | 3,095.1 | 2,754.1 | 2,938.6 | 3,032.9 | 3,130.2 | 3,230.7 | 3,334.3 |
| Inventories, % | 38.87 | 40.79 | 40.29 | 40.64 | 38.52 | 39.82 | 39.82 | 39.82 | 39.82 | 39.82 |
| Accounts Payable | 2,344.7 | 4,042.9 | 2,980.6 | 2,849.3 | 2,843.2 | 2,874.2 | 2,966.5 | 3,061.7 | 3,159.9 | 3,261.3 |
| Accounts Payable, % | 35.35 | 45.67 | 36.55 | 37.42 | 39.77 | 38.95 | 38.95 | 38.95 | 38.95 | 38.95 |
| Capital Expenditure | -244.9 | -487.8 | -294.8 | -221.4 | -217.5 | -277.0 | -285.9 | -295.0 | -304.5 | -314.3 |
| Capital Expenditure, % | -3.69 | -5.51 | -3.62 | -2.91 | -3.04 | -3.75 | -3.75 | -3.75 | -3.75 | -3.75 |
| Tax Rate, % | 7.62 | 7.62 | 7.62 | 7.62 | 7.62 | 7.62 | 7.62 | 7.62 | 7.62 | 7.62 |
| EBITAT | 576.9 | 765.1 | 424.0 | 268.0 | -140.8 | 352.9 | 364.3 | 376.0 | 388.0 | 400.5 |
| Depreciation | ||||||||||
| Changes in Account Receivables | ||||||||||
| Changes in Inventories | ||||||||||
| Changes in Accounts Payable | ||||||||||
| Capital Expenditure | ||||||||||
| UFCF | -4,364.2 | 419.9 | -244.3 | 354.6 | 689.5 | -47.2 | 120.6 | 124.4 | 128.4 | 132.5 |
| WACC, % | 5.04 | 4.98 | 4.95 | 4.99 | 5.01 | 4.99 | 4.99 | 4.99 | 4.99 | 4.99 |
| PV UFCF | ||||||||||
| SUM PV UFCF | 381.5 | |||||||||
| Long Term Growth Rate, % | 4.00 | |||||||||
| Free cash flow (T + 1) | 138 | |||||||||
| Terminal Value | 13,893 | |||||||||
| Present Terminal Value | 10,889 | |||||||||
| Enterprise Value | 11,271 | |||||||||
| Net Debt | -2,074 | |||||||||
| Equity Value | 13,345 | |||||||||
| Diluted Shares Outstanding, MM | 2,530 | |||||||||
| Equity Value Per Share | 5.27 |
What You'll Receive
- Customizable Excel Template: A fully editable Excel-based DCF Calculator featuring comprehensive financial data for Leyard Optoelectronic Co., Ltd. (300296SZ).
- Accurate Data: Access to historical performance and projected estimates (highlighted in the yellow cells).
- Flexible Forecasting: Adjust key assumptions such as revenue growth, EBITDA percentage, and WACC to fit your analysis.
- Instant Calculations: Quickly view how your inputs affect the valuation of Leyard Optoelectronic Co., Ltd. (300296SZ).
- Professional Resource: Designed for investors, CFOs, consultants, and financial analysts seeking in-depth insights.
- Intuitive Layout: Organized for user clarity and efficiency, complete with step-by-step guidance.
Key Features
- Accurate Financial Data for Leyard (300296SZ): Gain access to reliable historical figures and future forecasts.
- Adjustable Forecast Parameters: Modify highlighted cells for factors such as WACC, growth rates, and profit margins.
- Real-Time Calculations: Automatically refresh DCF, Net Present Value (NPV), and cash flow analyses.
- User-Friendly Dashboard: Intuitive charts and summaries for clear visualization of your valuation outcomes.
- Designed for All Experience Levels: An accessible framework tailored for investors, CFOs, and consultants alike.
How It Works
- Step 1: Download the Excel file.
- Step 2: Examine Leyard Optoelectronic Co., Ltd.’s pre-filled financial data and projections.
- Step 3: Adjust key inputs such as revenue growth, WACC, and tax rates (highlighted cells).
- Step 4: Observe the DCF model update in real-time as you modify assumptions.
- Step 5: Evaluate the results and leverage the findings for investment decisions regarding Leyard Optoelectronic Co., Ltd. (300296SZ).
Why Choose the Leyard Optoelectronic Valuation Tool?
- Precise Financial Insights: Utilize verified Leyard Optoelectronic financial data for dependable valuation outcomes.
- Flexible Adjustments: Modify essential variables such as growth forecasts, WACC, and tax rates to align with your expectations.
- Efficiency Boost: Pre-configured calculations save you time and effort compared to starting from the ground up.
- Expert-Quality Resource: Tailored for investors, analysts, and business consultants.
- Easy to Use: The user-friendly design and clear, step-by-step guidance cater to all levels of experience.
Who Should Use This Product?
- Individual Investors: Make informed choices regarding the purchase or sale of Leyard Optoelectronic Co., Ltd. (300296SZ) stock.
- Financial Analysts: Enhance valuation tasks using comprehensive financial models tailored for Leyard Optoelectronic Co., Ltd. (300296SZ).
- Consultants: Provide accurate and timely valuation insights related to Leyard Optoelectronic Co., Ltd. (300296SZ) for your clients.
- Business Owners: Gain insights into the valuation methods applied to large companies like Leyard Optoelectronic Co., Ltd. (300296SZ) to inform your own business strategies.
- Finance Students: Master valuation techniques through practical applications involving Leyard Optoelectronic Co., Ltd. (300296SZ) and its market data.
Contents of the Template
- Operating and Balance Sheet Data: Pre-filled historical data and forecasts for Leyard Optoelectronic Co., Ltd. (300296SZ), including revenue, EBITDA, EBIT, and capital expenditures.
- WACC Calculation: A specific sheet dedicated to the Weighted Average Cost of Capital (WACC), featuring parameters such as Beta, risk-free rate, and share price.
- DCF Valuation (Unlevered and Levered): Customizable Discounted Cash Flow models that illustrate intrinsic value along with comprehensive calculations.
- Financial Statements: Preloaded annual and quarterly financial statements to facilitate in-depth analysis.
- Key Ratios: Provides profitability, leverage, and efficiency ratios pertinent to Leyard Optoelectronic Co., Ltd. (300296SZ).
- Dashboard and Charts: A visual overview of valuation results and assumptions designed for easy analysis of outcomes.
Disclaimer
All information, articles, and product details provided on this website are for general informational and educational purposes only. We do not claim any ownership over, nor do we intend to infringe upon, any trademarks, copyrights, logos, brand names, or other intellectual property mentioned or depicted on this site. Such intellectual property remains the property of its respective owners, and any references here are made solely for identification or informational purposes, without implying any affiliation, endorsement, or partnership.
We make no representations or warranties, express or implied, regarding the accuracy, completeness, or suitability of any content or products presented. Nothing on this website should be construed as legal, tax, investment, financial, medical, or other professional advice. In addition, no part of this site—including articles or product references—constitutes a solicitation, recommendation, endorsement, advertisement, or offer to buy or sell any securities, franchises, or other financial instruments, particularly in jurisdictions where such activity would be unlawful.
All content is of a general nature and may not address the specific circumstances of any individual or entity. It is not a substitute for professional advice or services. Any actions you take based on the information provided here are strictly at your own risk. You accept full responsibility for any decisions or outcomes arising from your use of this website and agree to release us from any liability in connection with your use of, or reliance upon, the content or products found herein.