
|
Beijing Bohui Innovation Biotechnology Group Co., Ltd. (300318.SZ) DCF -Bewertung |
Fully Editable: Tailor To Your Needs In Excel Or Sheets
Professional Design: Trusted, Industry-Standard Templates
Investor-Approved Valuation Models
MAC/PC Compatible, Fully Unlocked
No Expertise Is Needed; Easy To Follow
Beijing Bohui Innovation Biotechnology Group Co., Ltd. (300318.SZ) Bundle
Verbessern Sie Ihre Anlagestrategie mit dem DCF -Taschenrechner (300318SZ)! Verwenden Sie die Authentic Peking Bohui Innovation Biotechnology Group Co., Ltd. Finanzdaten, Anpassungswachstumsprojektionen und -aufwendungen und beobachten Sie, wie sich diese Modifikationen in Echtzeit auf den inneren Wert von [Unternehmen] auswirken.
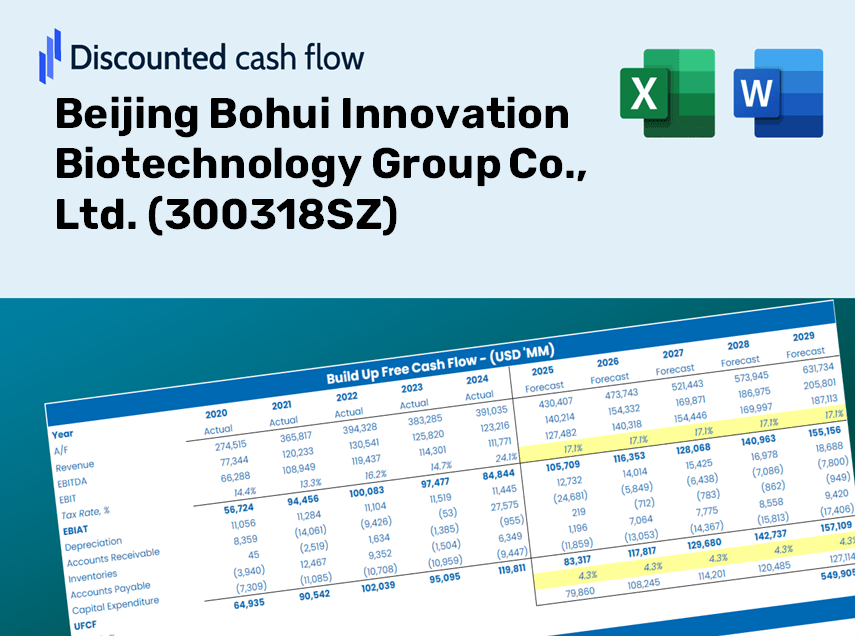
Discounted Cash Flow (DCF) - (USD MM)
| Year | AY1 2020 |
AY2 2021 |
AY3 2022 |
AY4 2023 |
AY5 2024 |
FY1 2025 |
FY2 2026 |
FY3 2027 |
FY4 2028 |
FY5 2029 |
|---|---|---|---|---|---|---|---|---|---|---|
| Revenue | 738.7 | 714.7 | 795.9 | 1,045.4 | 851.7 | 896.3 | 943.2 | 992.5 | 1,044.4 | 1,099.1 |
| Revenue Growth, % | 0 | -3.24 | 11.36 | 31.35 | -18.53 | 5.23 | 5.23 | 5.23 | 5.23 | 5.23 |
| EBITDA | 136.2 | -344.4 | 28.8 | 185.8 | 151.4 | 16.9 | 17.8 | 18.7 | 19.7 | 20.7 |
| EBITDA, % | 18.44 | -48.18 | 3.62 | 17.77 | 17.77 | 1.89 | 1.89 | 1.89 | 1.89 | 1.89 |
| Depreciation | 99.0 | 113.9 | 119.4 | 123.4 | 103.7 | 122.5 | 128.9 | 135.6 | 142.7 | 150.2 |
| Depreciation, % | 13.4 | 15.94 | 15 | 11.8 | 12.17 | 13.66 | 13.66 | 13.66 | 13.66 | 13.66 |
| EBIT | 37.2 | -458.3 | -90.6 | 62.4 | 47.7 | -105.6 | -111.1 | -116.9 | -123.0 | -129.5 |
| EBIT, % | 5.04 | -64.12 | -11.38 | 5.97 | 5.6 | -11.78 | -11.78 | -11.78 | -11.78 | -11.78 |
| Total Cash | 44.6 | 39.4 | 113.6 | 104.9 | 77.3 | 80.5 | 84.8 | 89.2 | 93.9 | 98.8 |
| Total Cash, percent | .0 | .0 | .0 | .0 | .0 | .0 | .0 | .0 | .0 | .0 |
| Account Receivables | 159.1 | 94.8 | 82.4 | 81.4 | 113.0 | 118.7 | 124.9 | 131.4 | 138.3 | 145.5 |
| Account Receivables, % | 21.53 | 13.27 | 10.35 | 7.78 | 13.27 | 13.24 | 13.24 | 13.24 | 13.24 | 13.24 |
| Inventories | 789.5 | 821.0 | 870.5 | 854.6 | 1,011.3 | 863.5 | 908.7 | 956.3 | 1,006.3 | 1,058.9 |
| Inventories, % | 106.88 | 114.86 | 109.37 | 81.74 | 118.73 | 96.35 | 96.35 | 96.35 | 96.35 | 96.35 |
| Accounts Payable | 132.6 | 227.1 | 302.4 | 261.2 | 229.0 | 250.2 | 263.3 | 277.1 | 291.6 | 306.8 |
| Accounts Payable, % | 17.95 | 31.78 | 37.99 | 24.98 | 26.89 | 27.92 | 27.92 | 27.92 | 27.92 | 27.92 |
| Capital Expenditure | -202.3 | -367.1 | -161.5 | -197.5 | -189.0 | -251.2 | -264.3 | -278.1 | -292.7 | -308.0 |
| Capital Expenditure, % | -27.39 | -51.35 | -20.29 | -18.9 | -22.19 | -28.02 | -28.02 | -28.02 | -28.02 | -28.02 |
| Tax Rate, % | 53.57 | 53.57 | 53.57 | 53.57 | 53.57 | 53.57 | 53.57 | 53.57 | 53.57 | 53.57 |
| EBITAT | 477.5 | -292.9 | -53.0 | -46.1 | 22.1 | -56.8 | -59.7 | -62.9 | -66.2 | -69.6 |
| Depreciation | ||||||||||
| Changes in Account Receivables | ||||||||||
| Changes in Inventories | ||||||||||
| Changes in Accounts Payable | ||||||||||
| Capital Expenditure | ||||||||||
| UFCF | -441.9 | -418.6 | -57.0 | -144.4 | -283.6 | -22.2 | -233.5 | -245.7 | -258.5 | -272.0 |
| WACC, % | 4.51 | 4.3 | 4.26 | 3.91 | 4.19 | 4.24 | 4.24 | 4.24 | 4.24 | 4.24 |
| PV UFCF | ||||||||||
| SUM PV UFCF | -893.2 | |||||||||
| Long Term Growth Rate, % | 2.00 | |||||||||
| Free cash flow (T + 1) | -277 | |||||||||
| Terminal Value | -12,412 | |||||||||
| Present Terminal Value | -10,087 | |||||||||
| Enterprise Value | -10,981 | |||||||||
| Net Debt | 803 | |||||||||
| Equity Value | -11,783 | |||||||||
| Diluted Shares Outstanding, MM | 817 | |||||||||
| Equity Value Per Share | -14.42 |
What You Will Receive
- Genuine Beijing Bohui Data: Preloaded financials – from revenue to EBIT – derived from actual and projected metrics.
- Comprehensive Customization: Modify all essential parameters (yellow cells) such as WACC, growth %, and tax rates.
- Instant Valuation Adjustments: Automatic recalculations to assess the effect of changes on Beijing Bohui's fair value.
- Flexible Excel Template: Designed for quick modifications, scenario analysis, and thorough projections.
- Efficient and Accurate: Eliminate the need to build models from the ground up while ensuring precision and adaptability.
Key Features
- 🔍 Real-Life [Symbol] Financials: Pre-filled historical and projected data for Beijing Bohui Innovation Biotechnology Group Co., Ltd. (300318SZ).
- ✏️ Fully Customizable Inputs: Modify all essential parameters (yellow cells) such as WACC, growth %, and tax rates.
- 📊 Professional DCF Valuation: Integrated formulas to determine the intrinsic value of Beijing Bohui using the Discounted Cash Flow method.
- ⚡ Instant Results: Immediately visualize the valuation of Beijing Bohui after making adjustments.
- Scenario Analysis: Evaluate and compare results for different financial assumptions side-by-side.
How It Functions
- Download: Obtain the ready-to-use Excel file featuring Beijing Bohui Innovation Biotechnology Group Co., Ltd.'s (300318SZ) financial data.
- Customize: Tailor predictions, including revenue growth, EBITDA percentage, and WACC.
- Update Instantly: Watch as intrinsic value and NPV calculations refresh in real-time.
- Explore Scenarios: Generate various projections and compare results instantly.
- Make Informed Choices: Leverage the valuation outcomes to shape your investment decisions.
Why Choose This Calculator for Beijing Bohui Innovation Biotechnology Group Co., Ltd. (300318SZ)?
- User-Friendly Interface: Perfectly suited for both novice and experienced users.
- Customizable Inputs: Adjust parameters easily to tailor your analysis.
- Real-Time Valuation: Instantly observe how changes affect Beijing Bohui's valuation.
- Pre-Configured Data: Comes with Beijing Bohui's actual financial figures for efficient analysis.
- Preferred by Experts: Trusted by investors and analysts for strategic decision-making.
Who Can Benefit from Our Product?
- Investors: Gain assurance in your investment choices with our advanced valuation tool.
- Financial Analysts: Streamline your workflow with a customizable DCF model at your fingertips.
- Consultants: Efficiently tailor the template for impactful client presentations and reports.
- Finance Enthusiasts: Enhance your knowledge of valuation methods through real-life case studies.
- Educators and Students: Leverage this resource as a hands-on learning aid in finance courses.
Contents of the Template
- Preloaded 300318SZ Data: Historical and forecasted financial information, including revenue, EBIT, and capital expenditures.
- DCF and WACC Models: Advanced spreadsheets for determining intrinsic value and Weighted Average Cost of Capital.
- Editable Inputs: Yellow-highlighted cells for modifying revenue growth, tax rates, and discount rates.
- Financial Statements: Detailed annual and quarterly financial statements for thorough analysis.
- Key Ratios: Metrics for profitability, leverage, and efficiency to assess performance.
- Dashboard and Charts: Visual representations of valuation results and underlying assumptions.
Disclaimer
All information, articles, and product details provided on this website are for general informational and educational purposes only. We do not claim any ownership over, nor do we intend to infringe upon, any trademarks, copyrights, logos, brand names, or other intellectual property mentioned or depicted on this site. Such intellectual property remains the property of its respective owners, and any references here are made solely for identification or informational purposes, without implying any affiliation, endorsement, or partnership.
We make no representations or warranties, express or implied, regarding the accuracy, completeness, or suitability of any content or products presented. Nothing on this website should be construed as legal, tax, investment, financial, medical, or other professional advice. In addition, no part of this site—including articles or product references—constitutes a solicitation, recommendation, endorsement, advertisement, or offer to buy or sell any securities, franchises, or other financial instruments, particularly in jurisdictions where such activity would be unlawful.
All content is of a general nature and may not address the specific circumstances of any individual or entity. It is not a substitute for professional advice or services. Any actions you take based on the information provided here are strictly at your own risk. You accept full responsibility for any decisions or outcomes arising from your use of this website and agree to release us from any liability in connection with your use of, or reliance upon, the content or products found herein.