
|
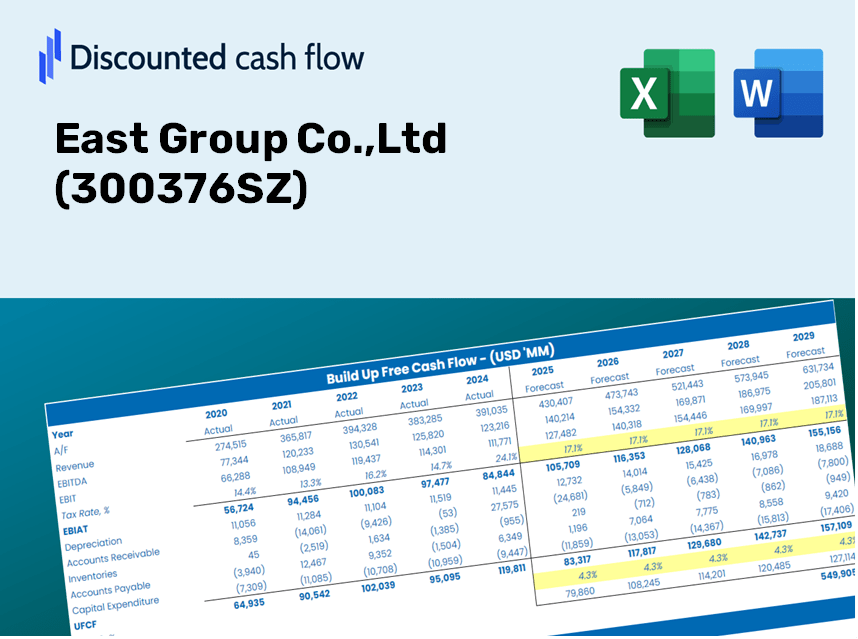
East Group Co., Ltd (300376.SZ) DCF -Bewertung |
Fully Editable: Tailor To Your Needs In Excel Or Sheets
Professional Design: Trusted, Industry-Standard Templates
Investor-Approved Valuation Models
MAC/PC Compatible, Fully Unlocked
No Expertise Is Needed; Easy To Follow
East Group Co.,Ltd (300376.SZ) Bundle
Entdecken Sie das finanzielle Potenzial von East Group Co., Ltd mit unserem benutzerfreundlichen DCF-Taschenrechner! Geben Sie einfach Ihre Annahmen für Wachstum, Margen und Kosten für die Berechnung des inneren Werts von East Group Co., Ltd (300376SZ) ein und verbessern Sie Ihre Anlagestrategie.
Discounted Cash Flow (DCF) - (USD MM)
| Year | AY1 2020 |
AY2 2021 |
AY3 2022 |
AY4 2023 |
AY5 2024 |
FY1 2025 |
FY2 2026 |
FY3 2027 |
FY4 2028 |
FY5 2029 |
|---|---|---|---|---|---|---|---|---|---|---|
| Revenue | 4,170.8 | 4,297.0 | 4,741.6 | 4,792.6 | 3,043.8 | 2,876.1 | 2,717.6 | 2,567.9 | 2,426.4 | 2,292.7 |
| Revenue Growth, % | 0 | 3.03 | 10.35 | 1.07 | -36.49 | -5.51 | -5.51 | -5.51 | -5.51 | -5.51 |
| EBITDA | 1,060.7 | 838.1 | 726.0 | 844.7 | 604.8 | 562.2 | 531.3 | 502.0 | 474.3 | 448.2 |
| EBITDA, % | 25.43 | 19.5 | 15.31 | 17.63 | 19.87 | 19.55 | 19.55 | 19.55 | 19.55 | 19.55 |
| Depreciation | 281.1 | 296.8 | 284.7 | 296.5 | 261.6 | 198.1 | 187.2 | 176.9 | 167.1 | 157.9 |
| Depreciation, % | 6.74 | 6.91 | 6.01 | 6.19 | 8.6 | 6.89 | 6.89 | 6.89 | 6.89 | 6.89 |
| EBIT | 779.7 | 541.3 | 441.2 | 548.2 | 343.2 | 364.2 | 344.1 | 325.1 | 307.2 | 290.3 |
| EBIT, % | 18.69 | 12.6 | 9.3 | 11.44 | 11.27 | 12.66 | 12.66 | 12.66 | 12.66 | 12.66 |
| Total Cash | 1,411.6 | 1,285.0 | 1,841.7 | 2,428.5 | 1,992.4 | 1,258.1 | 1,188.8 | 1,123.3 | 1,061.4 | 1,002.9 |
| Total Cash, percent | .0 | .0 | .0 | .0 | .0 | .0 | .0 | .0 | .0 | .0 |
| Account Receivables | 3,881.8 | 4,086.9 | 4,258.0 | 3,914.9 | 3,396.6 | 2,644.1 | 2,498.4 | 2,360.7 | 2,230.7 | 2,107.7 |
| Account Receivables, % | 93.07 | 95.11 | 89.8 | 81.69 | 111.59 | 91.93 | 91.93 | 91.93 | 91.93 | 91.93 |
| Inventories | 676.5 | 730.7 | 1,291.0 | 1,583.7 | 1,113.6 | 748.3 | 707.0 | 668.1 | 631.3 | 596.5 |
| Inventories, % | 16.22 | 17.01 | 27.23 | 33.05 | 36.59 | 26.02 | 26.02 | 26.02 | 26.02 | 26.02 |
| Accounts Payable | 2,572.0 | 1,839.2 | 1,793.7 | 2,155.0 | 1,454.7 | 1,352.1 | 1,277.6 | 1,207.2 | 1,140.7 | 1,077.8 |
| Accounts Payable, % | 61.67 | 42.8 | 37.83 | 44.97 | 47.79 | 47.01 | 47.01 | 47.01 | 47.01 | 47.01 |
| Capital Expenditure | -572.6 | -501.1 | -198.6 | -248.8 | -328.5 | -262.1 | -247.7 | -234.0 | -221.1 | -208.9 |
| Capital Expenditure, % | -13.73 | -11.66 | -4.19 | -5.19 | -10.79 | -9.11 | -9.11 | -9.11 | -9.11 | -9.11 |
| Tax Rate, % | 18.91 | 18.91 | 18.91 | 18.91 | 18.91 | 18.91 | 18.91 | 18.91 | 18.91 | 18.91 |
| EBITAT | 678.8 | 454.7 | 341.8 | 475.1 | 278.3 | 303.2 | 286.5 | 270.7 | 255.8 | 241.7 |
| Depreciation | ||||||||||
| Changes in Account Receivables | ||||||||||
| Changes in Inventories | ||||||||||
| Changes in Accounts Payable | ||||||||||
| Capital Expenditure | ||||||||||
| UFCF | -1,599.0 | -741.7 | -348.9 | 934.6 | 499.5 | 1,254.4 | 338.4 | 319.8 | 302.2 | 285.5 |
| WACC, % | 5.74 | 5.72 | 5.66 | 5.74 | 5.69 | 5.71 | 5.71 | 5.71 | 5.71 | 5.71 |
| PV UFCF | ||||||||||
| SUM PV UFCF | 2,218.4 | |||||||||
| Long Term Growth Rate, % | 3.50 | |||||||||
| Free cash flow (T + 1) | 296 | |||||||||
| Terminal Value | 13,359 | |||||||||
| Present Terminal Value | 10,119 | |||||||||
| Enterprise Value | 12,338 | |||||||||
| Net Debt | -745 | |||||||||
| Equity Value | 13,082 | |||||||||
| Diluted Shares Outstanding, MM | 2,365 | |||||||||
| Equity Value Per Share | 5.53 |
What You Will Receive
- Pre-Built Financial Model: Leverage East Group Co.,Ltd’s real data for accurate DCF analysis.
- Comprehensive Forecasting Control: Modify revenue growth, profit margins, WACC, and other essential metrics.
- Real-Time Calculations: Automatic updates provide immediate feedback as you make adjustments.
- Professional-Grade Template: A polished Excel file crafted for high-quality valuation.
- Flexible and Reusable: Designed for adaptability, allowing for multiple uses in detailed forecasting.
Key Features
- Customizable Financial Variables: Adjust essential inputs such as revenue growth, EBITDA %, and capital expenditures.
- Instant DCF Valuation: Automatically computes intrinsic value, NPV, and other relevant metrics.
- Precision Analysis: Leverages East Group Co., Ltd's (300376SZ) actual financial data for accurate valuation results.
- Simplified Scenario Testing: Effortlessly explore various assumptions and evaluate different outcomes.
- Efficiency-Oriented Solution: Avoid the complexities of creating valuation models from the ground up.
How It Operates
- Download the Template: Gain immediate access to the Excel-based East Group Co., Ltd DCF Calculator.
- Input Your Assumptions: Modify the yellow-highlighted cells for growth rates, WACC, margins, and other parameters.
- Instant Calculations: The model automatically recalculates the intrinsic value of East Group Co., Ltd ([300376SZ]).
- Test Scenarios: Explore different assumptions to assess potential variations in valuation.
- Analyze and Decide: Utilize the results to inform your investment strategy or financial analysis.
Why Choose This Calculator for East Group Co., Ltd (300376SZ)?
- Designed for Experts: A sophisticated tool favored by analysts, CFOs, and consultants.
- Up-to-Date Data: East Group’s historical and projected financials are preloaded for precision.
- Versatile Scenario Analysis: Easily simulate various forecasts and assumptions.
- Comprehensive Outputs: Automatically computes intrinsic value, NPV, and essential metrics.
- User-Friendly: Step-by-step guidance helps you navigate the calculation process effortlessly.
Who Can Benefit from East Group Co., Ltd (300376SZ)?
- Finance Students: Explore valuation methodologies and utilize them with actual market data.
- Academics: Integrate industry-standard models into your lectures or research projects.
- Investors: Validate your investment hypotheses and evaluate the valuation results for East Group Co., Ltd (300376SZ).
- Analysts: Enhance your efficiency with a customizable DCF model tailored for your analysis.
- Small Business Owners: Understand the analytical approaches used for evaluating major publicly traded firms like East Group Co., Ltd (300376SZ).
Contents of the Template
- Preloaded East Group Co.,Ltd (300376SZ) Data: Comprehensive historical and forecasted financial information, including revenue, EBIT, and capital expenditures.
- DCF and WACC Models: High-quality worksheets designed for calculating the intrinsic value and Weighted Average Cost of Capital.
- Editable Inputs: Cells highlighted in yellow to facilitate adjustments for revenue growth, tax rates, and discount rates.
- Financial Statements: Detailed annual and quarterly financials for thorough analysis.
- Key Ratios: Metrics on profitability, leverage, and efficiency to assess company performance.
- Dashboard and Charts: Visual representations of valuation results and underlying assumptions.
Disclaimer
All information, articles, and product details provided on this website are for general informational and educational purposes only. We do not claim any ownership over, nor do we intend to infringe upon, any trademarks, copyrights, logos, brand names, or other intellectual property mentioned or depicted on this site. Such intellectual property remains the property of its respective owners, and any references here are made solely for identification or informational purposes, without implying any affiliation, endorsement, or partnership.
We make no representations or warranties, express or implied, regarding the accuracy, completeness, or suitability of any content or products presented. Nothing on this website should be construed as legal, tax, investment, financial, medical, or other professional advice. In addition, no part of this site—including articles or product references—constitutes a solicitation, recommendation, endorsement, advertisement, or offer to buy or sell any securities, franchises, or other financial instruments, particularly in jurisdictions where such activity would be unlawful.
All content is of a general nature and may not address the specific circumstances of any individual or entity. It is not a substitute for professional advice or services. Any actions you take based on the information provided here are strictly at your own risk. You accept full responsibility for any decisions or outcomes arising from your use of this website and agree to release us from any liability in connection with your use of, or reliance upon, the content or products found herein.