
|
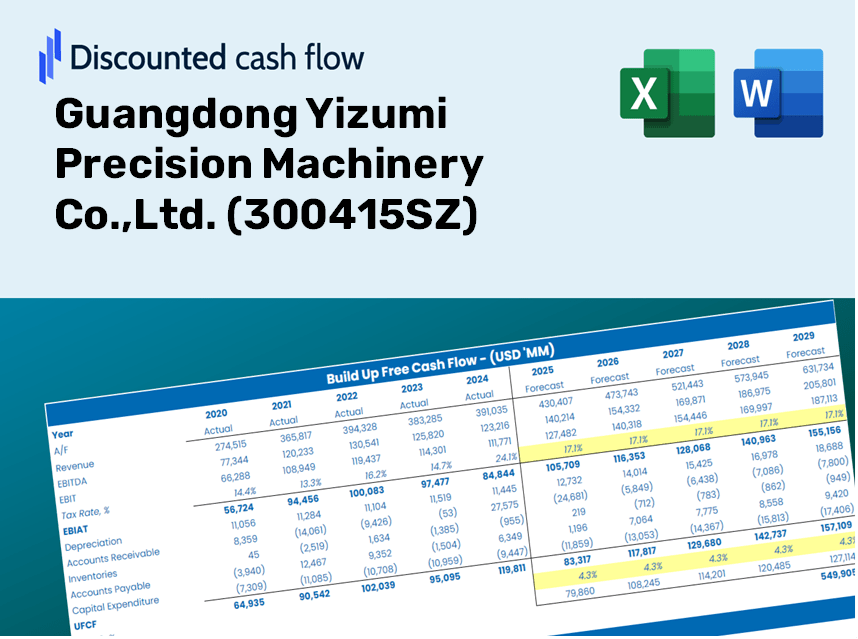
Guangdong Yizumi Precision Machinery Co., Ltd. (300415.SZ) DCF -Bewertung |
Fully Editable: Tailor To Your Needs In Excel Or Sheets
Professional Design: Trusted, Industry-Standard Templates
Investor-Approved Valuation Models
MAC/PC Compatible, Fully Unlocked
No Expertise Is Needed; Easy To Follow
Guangdong Yizumi Precision Machinery Co.,Ltd. (300415.SZ) Bundle
Möchten Sie den inneren Wert von Guangdong Yizumi Precision Machinery Co., Ltd., berechnen? Unser DCF-Taschenrechner (300415SZ) integriert reale Daten mit umfassenden Anpassungsfunktionen, sodass Sie Ihre Prognosen verfeinern und Ihre Investitionsauswahl verbessern können.
Discounted Cash Flow (DCF) - (USD MM)
| Year | AY1 2020 |
AY2 2021 |
AY3 2022 |
AY4 2023 |
AY5 2024 |
FY1 2025 |
FY2 2026 |
FY3 2027 |
FY4 2028 |
FY5 2029 |
|---|---|---|---|---|---|---|---|---|---|---|
| Revenue | 2,718.2 | 3,532.9 | 3,679.9 | 4,095.8 | 5,063.0 | 5,937.0 | 6,961.8 | 8,163.6 | 9,572.8 | 11,225.2 |
| Revenue Growth, % | 0 | 29.97 | 4.16 | 11.3 | 23.61 | 17.26 | 17.26 | 17.26 | 17.26 | 17.26 |
| EBITDA | 471.7 | 695.7 | 573.5 | 739.0 | 903.4 | 1,051.0 | 1,232.5 | 1,445.2 | 1,694.7 | 1,987.2 |
| EBITDA, % | 17.35 | 19.69 | 15.58 | 18.04 | 17.84 | 17.7 | 17.7 | 17.7 | 17.7 | 17.7 |
| Depreciation | 90.5 | 102.4 | 113.2 | 133.1 | 138.3 | 181.5 | 212.8 | 249.5 | 292.6 | 343.1 |
| Depreciation, % | 3.33 | 2.9 | 3.08 | 3.25 | 2.73 | 3.06 | 3.06 | 3.06 | 3.06 | 3.06 |
| EBIT | 381.3 | 593.3 | 460.3 | 605.9 | 765.1 | 869.5 | 1,019.7 | 1,195.7 | 1,402.1 | 1,644.1 |
| EBIT, % | 14.03 | 16.79 | 12.51 | 14.79 | 15.11 | 14.65 | 14.65 | 14.65 | 14.65 | 14.65 |
| Total Cash | 398.8 | 386.0 | 563.6 | 478.5 | 499.2 | 741.6 | 869.6 | 1,019.7 | 1,195.8 | 1,402.2 |
| Total Cash, percent | .0 | .0 | .0 | .0 | .0 | .0 | .0 | .0 | .0 | .0 |
| Account Receivables | 829.2 | 918.7 | 1,148.0 | 1,668.6 | 1,736.2 | 1,932.3 | 2,265.9 | 2,657.1 | 3,115.7 | 3,653.6 |
| Account Receivables, % | 30.51 | 26 | 31.2 | 40.74 | 34.29 | 32.55 | 32.55 | 32.55 | 32.55 | 32.55 |
| Inventories | 872.4 | 1,259.8 | 1,353.3 | 1,548.1 | 1,850.5 | 2,124.0 | 2,490.6 | 2,920.5 | 3,424.7 | 4,015.8 |
| Inventories, % | 32.09 | 35.66 | 36.77 | 37.8 | 36.55 | 35.78 | 35.78 | 35.78 | 35.78 | 35.78 |
| Accounts Payable | 813.2 | 855.5 | 1,045.3 | 1,295.5 | 1,562.9 | 1,722.2 | 2,019.4 | 2,368.0 | 2,776.8 | 3,256.2 |
| Accounts Payable, % | 29.92 | 24.21 | 28.41 | 31.63 | 30.87 | 29.01 | 29.01 | 29.01 | 29.01 | 29.01 |
| Capital Expenditure | -336.9 | -297.3 | -452.1 | -224.6 | -287.4 | -525.5 | -616.2 | -722.6 | -847.3 | -993.6 |
| Capital Expenditure, % | -12.39 | -8.42 | -12.29 | -5.48 | -5.68 | -8.85 | -8.85 | -8.85 | -8.85 | -8.85 |
| Tax Rate, % | 15.67 | 15.67 | 15.67 | 15.67 | 15.67 | 15.67 | 15.67 | 15.67 | 15.67 | 15.67 |
| EBITAT | 319.7 | 503.7 | 395.4 | 509.6 | 645.2 | 735.8 | 862.9 | 1,011.8 | 1,186.5 | 1,391.3 |
| Depreciation | ||||||||||
| Changes in Account Receivables | ||||||||||
| Changes in Inventories | ||||||||||
| Changes in Accounts Payable | ||||||||||
| Capital Expenditure | ||||||||||
| UFCF | -815.1 | -125.8 | -76.4 | -47.1 | 393.6 | 81.4 | 56.5 | 66.3 | 77.7 | 91.2 |
| WACC, % | 6.06 | 6.06 | 6.07 | 6.06 | 6.06 | 6.06 | 6.06 | 6.06 | 6.06 | 6.06 |
| PV UFCF | ||||||||||
| SUM PV UFCF | 311.9 | |||||||||
| Long Term Growth Rate, % | 3.50 | |||||||||
| Free cash flow (T + 1) | 94 | |||||||||
| Terminal Value | 3,683 | |||||||||
| Present Terminal Value | 2,744 | |||||||||
| Enterprise Value | 3,056 | |||||||||
| Net Debt | 637 | |||||||||
| Equity Value | 2,419 | |||||||||
| Diluted Shares Outstanding, MM | 461 | |||||||||
| Equity Value Per Share | 5.25 |
What You Will Receive
- Authentic Yizumi Data: Preloaded financial information – covering everything from revenue to EBIT – derived from actual and projected figures.
- Complete Customization: Modify all essential parameters (yellow cells) such as WACC, growth rates, and tax percentages.
- Instant Valuation Adjustments: Automatic recalculations to evaluate the effect of changes on Yizumi’s fair value.
- Flexible Excel Template: Designed for quick modifications, scenario analysis, and comprehensive projections.
- Time-Efficient and Precise: Avoid the hassle of building models from the ground up while ensuring accuracy and adaptability.
Key Features
- Customizable Forecast Inputs: Adjust essential metrics such as revenue growth, EBITDA margins, and capital expenditures.
- Instant DCF Valuation: Automatically computes intrinsic value, NPV, and other financial metrics without delay.
- High-Precision Accuracy: Utilizes Guangdong Yizumi's actual financial data for dependable valuation results.
- Effortless Scenario Analysis: Easily evaluate various assumptions and juxtapose results for informed decision-making.
- Efficiency Booster: Streamlines the valuation process, removing the need to create intricate models from the ground up.
How It Works
- Step 1: Download the preconfigured Excel template containing Guangdong Yizumi Precision Machinery Co., Ltd.’s data.
- Step 2: Examine the pre-filled sheets to familiarize yourself with the essential metrics.
- Step 3: Revise forecasts and assumptions in the editable yellow cells (WACC, growth, margins).
- Step 4: View updated results instantly, including the intrinsic value of Guangdong Yizumi Precision Machinery Co., Ltd. (300415SZ).
- Step 5: Use the generated outputs to make informed investment decisions or create detailed reports.
Why Choose Yizumi Precision Machinery?
- Save Time: Instantly access expert-level calculations without building models from the ground up.
- Enhance Accuracy: Dependable data and formulas help minimize valuation errors.
- Fully Customizable: Adapt the model to suit your unique assumptions and forecasts.
- Easy to Analyze: Intuitive charts and outputs simplify result interpretation.
- Endorsed by Professionals: Created for specialists who prioritize accuracy and functionality.
Who Should Consider This Product?
- Engineering Students: Master precision machinery techniques using real-world case studies.
- Researchers: Integrate advanced machinery models into academic studies and publications.
- Manufacturers: Evaluate your production strategies and assess outcomes with Guangdong Yizumi’s machinery systems.
- Industry Analysts: Enhance your analysis toolkit with a customizable model tailored for precision equipment.
- Entrepreneurs: Understand the approaches large manufacturers like Guangdong Yizumi (300415SZ) use in their operations.
What the Template Contains
- Preloaded Yizumi Data: Historical and projected financial information, including revenue, EBIT, and capital expenditures.
- DCF and WACC Models: Professional-grade spreadsheets for determining intrinsic value and Weighted Average Cost of Capital.
- Editable Inputs: Cells highlighted in yellow for modifying revenue growth, tax rates, and discount rates.
- Financial Statements: Detailed annual and quarterly financials for in-depth analysis.
- Key Ratios: Ratios for profitability, leverage, and efficiency to assess performance.
- Dashboard and Charts: Visual representations of valuation results and assumptions.
Disclaimer
All information, articles, and product details provided on this website are for general informational and educational purposes only. We do not claim any ownership over, nor do we intend to infringe upon, any trademarks, copyrights, logos, brand names, or other intellectual property mentioned or depicted on this site. Such intellectual property remains the property of its respective owners, and any references here are made solely for identification or informational purposes, without implying any affiliation, endorsement, or partnership.
We make no representations or warranties, express or implied, regarding the accuracy, completeness, or suitability of any content or products presented. Nothing on this website should be construed as legal, tax, investment, financial, medical, or other professional advice. In addition, no part of this site—including articles or product references—constitutes a solicitation, recommendation, endorsement, advertisement, or offer to buy or sell any securities, franchises, or other financial instruments, particularly in jurisdictions where such activity would be unlawful.
All content is of a general nature and may not address the specific circumstances of any individual or entity. It is not a substitute for professional advice or services. Any actions you take based on the information provided here are strictly at your own risk. You accept full responsibility for any decisions or outcomes arising from your use of this website and agree to release us from any liability in connection with your use of, or reliance upon, the content or products found herein.