
|
Sunresin New Materials Co., Ltd (300487.SZ) DCF -Bewertung |
Fully Editable: Tailor To Your Needs In Excel Or Sheets
Professional Design: Trusted, Industry-Standard Templates
Investor-Approved Valuation Models
MAC/PC Compatible, Fully Unlocked
No Expertise Is Needed; Easy To Follow
Sunresin New Materials Co.,Ltd (300487.SZ) Bundle
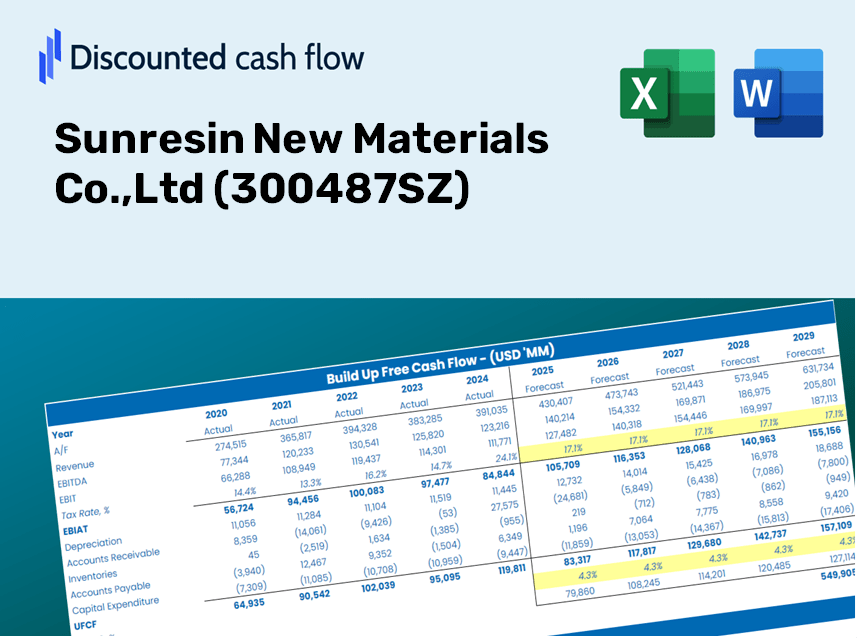
Erwerben Sie die Bewertungsanalyse für Ihre Sunresin New Materials Co., Ltd (300487SZ) mit unserem ausgefeilten DCF -Taschenrechner! Diese Excel -Vorlage wird mit realen (300487SZ) Daten vorinstalliert, sodass Sie die Vorhersagen und Annahmen für eine genaue Berechnung des inneren Wertes von Sunresin anpassen können.
Discounted Cash Flow (DCF) - (USD MM)
| Year | AY1 2020 |
AY2 2021 |
AY3 2022 |
AY4 2023 |
AY5 2024 |
FY1 2025 |
FY2 2026 |
FY3 2027 |
FY4 2028 |
FY5 2029 |
|---|---|---|---|---|---|---|---|---|---|---|
| Revenue | 922.6 | 1,194.9 | 1,920.1 | 2,488.8 | 2,554.0 | 3,335.8 | 4,356.9 | 5,690.6 | 7,432.5 | 9,707.6 |
| Revenue Growth, % | 0 | 29.51 | 60.69 | 29.62 | 2.62 | 30.61 | 30.61 | 30.61 | 30.61 | 30.61 |
| EBITDA | 320.5 | 451.8 | 723.6 | 980.7 | 1,080.5 | 1,280.6 | 1,672.6 | 2,184.6 | 2,853.3 | 3,726.7 |
| EBITDA, % | 34.74 | 37.81 | 37.69 | 39.4 | 42.31 | 38.39 | 38.39 | 38.39 | 38.39 | 38.39 |
| Depreciation | 90.1 | 96.7 | 105.3 | 128.9 | 131.5 | 224.7 | 293.4 | 383.3 | 500.6 | 653.8 |
| Depreciation, % | 9.77 | 8.09 | 5.48 | 5.18 | 5.15 | 6.74 | 6.74 | 6.74 | 6.74 | 6.74 |
| EBIT | 230.4 | 355.1 | 618.3 | 851.7 | 949.0 | 1,055.9 | 1,379.1 | 1,801.3 | 2,352.7 | 3,072.8 |
| EBIT, % | 24.97 | 29.72 | 32.2 | 34.22 | 37.16 | 31.65 | 31.65 | 31.65 | 31.65 | 31.65 |
| Total Cash | 606.5 | 804.3 | 1,492.5 | 2,338.8 | 2,353.8 | 2,648.0 | 3,458.6 | 4,517.3 | 5,900.0 | 7,706.1 |
| Total Cash, percent | .0 | .0 | .0 | .0 | .0 | .0 | .0 | .0 | .0 | .0 |
| Account Receivables | 428.0 | 580.5 | 646.6 | 739.8 | 848.7 | 1,278.3 | 1,669.6 | 2,180.7 | 2,848.2 | 3,720.0 |
| Account Receivables, % | 46.39 | 48.58 | 33.68 | 29.72 | 33.23 | 38.32 | 38.32 | 38.32 | 38.32 | 38.32 |
| Inventories | 332.4 | 472.5 | 962.7 | 1,100.1 | 1,155.1 | 1,435.3 | 1,874.7 | 2,448.5 | 3,198.0 | 4,176.9 |
| Inventories, % | 36.03 | 39.55 | 50.14 | 44.2 | 45.23 | 43.03 | 43.03 | 43.03 | 43.03 | 43.03 |
| Accounts Payable | 291.6 | 262.3 | 506.7 | 545.7 | 442.9 | 795.4 | 1,038.8 | 1,356.8 | 1,772.1 | 2,314.6 |
| Accounts Payable, % | 31.61 | 21.95 | 26.39 | 21.92 | 17.34 | 23.84 | 23.84 | 23.84 | 23.84 | 23.84 |
| Capital Expenditure | -53.2 | -139.7 | -80.7 | -159.8 | -178.9 | -234.1 | -305.7 | -399.3 | -521.5 | -681.2 |
| Capital Expenditure, % | -5.77 | -11.69 | -4.2 | -6.42 | -7 | -7.02 | -7.02 | -7.02 | -7.02 | -7.02 |
| Tax Rate, % | 13.21 | 13.21 | 13.21 | 13.21 | 13.21 | 13.21 | 13.21 | 13.21 | 13.21 | 13.21 |
| EBITAT | 214.8 | 318.1 | 543.6 | 747.2 | 823.6 | 940.3 | 1,228.1 | 1,604.0 | 2,095.0 | 2,736.2 |
| Depreciation | ||||||||||
| Changes in Account Receivables | ||||||||||
| Changes in Inventories | ||||||||||
| Changes in Accounts Payable | ||||||||||
| Capital Expenditure | ||||||||||
| UFCF | -217.1 | -46.8 | 256.3 | 524.7 | 509.5 | 573.5 | 628.6 | 821.0 | 1,072.3 | 1,400.6 |
| WACC, % | 5.77 | 5.77 | 5.77 | 5.77 | 5.77 | 5.77 | 5.77 | 5.77 | 5.77 | 5.77 |
| PV UFCF | ||||||||||
| SUM PV UFCF | 3,712.8 | |||||||||
| Long Term Growth Rate, % | 4.00 | |||||||||
| Free cash flow (T + 1) | 1,457 | |||||||||
| Terminal Value | 82,350 | |||||||||
| Present Terminal Value | 62,212 | |||||||||
| Enterprise Value | 65,925 | |||||||||
| Net Debt | -1,794 | |||||||||
| Equity Value | 67,719 | |||||||||
| Diluted Shares Outstanding, MM | 508 | |||||||||
| Equity Value Per Share | 133.33 |
What You Will Receive
- Customizable Excel Template: A fully adaptable Excel-based DCF Calculator featuring real financial data for Sunresin New Materials Co., Ltd (300487SZ).
- Actual Data: Access to historical figures and projections (highlighted in the yellow cells).
- Forecasting Flexibility: Modify forecast parameters such as revenue growth, EBITDA %, and WACC.
- Instant Calculations: Quickly observe how your inputs affect the valuation of Sunresin New Materials Co., Ltd (300487SZ).
- Professional-grade Tool: Designed for investors, CFOs, consultants, and financial analysts.
- User-Friendly Interface: Organized for clarity and simplicity, complete with step-by-step guidance.
Key Features
- Accurate Sunresin Data: Pre-loaded with historical financial information and future projections for Sunresin New Materials Co., Ltd (300487SZ).
- Comprehensive Input Customization: Tailor revenue growth rates, profit margins, WACC, tax rates, and capital expenditures to fit your analysis.
- Adaptive Valuation Model: Instantly updates Net Present Value (NPV) and intrinsic value in response to your adjustments.
- Scenario Analysis: Develop various forecasting scenarios to evaluate different potential valuation results.
- Intuitive User Interface: Designed with simplicity and clarity, suitable for both seasoned professionals and newcomers.
How It Works
- Step 1: Download the Excel file.
- Step 2: Examine the pre-filled data for Sunresin New Materials Co., Ltd (300487SZ) - [Symbol] (historical and projected).
- Step 3: Modify key assumptions (yellow cells) according to your analysis.
- Step 4: Check the automatic recalculations for the intrinsic value of Sunresin New Materials Co., Ltd (300487SZ) - [Symbol].
- Step 5: Utilize the results for making investment decisions or for reporting purposes.
Why Select This Calculator for Sunresin New Materials Co., Ltd (300487SZ)?
- User-Friendly Interface: Crafted to cater to both novices and seasoned professionals.
- Customizable Inputs: Adjust parameters effortlessly to suit your financial analysis needs.
- Real-Time Insights: Witness immediate updates to Sunresin's valuation as you modify the inputs.
- Pre-Loaded Data: Comes with Sunresin's actual financial details for streamlined assessment.
- Relied Upon by Experts: Favored by investors and analysts for making educated financial decisions.
Who Can Benefit from This Product?
- Investors: Accurately assess the fair value of Sunresin New Materials Co., Ltd (300487SZ) before making investment choices.
- CFOs: Utilize a professional-grade DCF model for comprehensive financial reporting and analysis.
- Consultants: Efficiently customize the template for valuation reports tailored to client needs.
- Entrepreneurs: Acquire insights into the financial modeling practices employed by leading organizations.
- Educators: Implement it as a teaching resource to illustrate various valuation techniques.
Overview of the Template Components
- Historical Data: Contains Sunresin's previous financial performance and foundational forecasts.
- DCF and Levered DCF Models: Comprehensive templates for calculating the intrinsic value of Sunresin (300487SZ).
- WACC Sheet: Built-in calculations for the Weighted Average Cost of Capital.
- Editable Inputs: Adjust critical factors such as growth rates, EBITDA %, and CAPEX assumptions.
- Quarterly and Annual Statements: An in-depth analysis of Sunresin's financial statements.
- Interactive Dashboard: Dynamically visualize valuation outcomes and forecasts.
Disclaimer
All information, articles, and product details provided on this website are for general informational and educational purposes only. We do not claim any ownership over, nor do we intend to infringe upon, any trademarks, copyrights, logos, brand names, or other intellectual property mentioned or depicted on this site. Such intellectual property remains the property of its respective owners, and any references here are made solely for identification or informational purposes, without implying any affiliation, endorsement, or partnership.
We make no representations or warranties, express or implied, regarding the accuracy, completeness, or suitability of any content or products presented. Nothing on this website should be construed as legal, tax, investment, financial, medical, or other professional advice. In addition, no part of this site—including articles or product references—constitutes a solicitation, recommendation, endorsement, advertisement, or offer to buy or sell any securities, franchises, or other financial instruments, particularly in jurisdictions where such activity would be unlawful.
All content is of a general nature and may not address the specific circumstances of any individual or entity. It is not a substitute for professional advice or services. Any actions you take based on the information provided here are strictly at your own risk. You accept full responsibility for any decisions or outcomes arising from your use of this website and agree to release us from any liability in connection with your use of, or reliance upon, the content or products found herein.