
|
Hubei Century Network Technology Inc. (300494.SZ) DCF -Bewertung |
Fully Editable: Tailor To Your Needs In Excel Or Sheets
Professional Design: Trusted, Industry-Standard Templates
Investor-Approved Valuation Models
MAC/PC Compatible, Fully Unlocked
No Expertise Is Needed; Easy To Follow
Hubei Century Network Technology Inc. (300494.SZ) Bundle
Mit unserem (300494SZ) DCF-Taschenrechner, der für die Genauigkeit entwickelt wurde, können Sie die Bewertung von Hubei Century Network Technology Inc. unter Verwendung von Finanzdaten in Echtzeit bewerten und gleichzeitig vollständige Flexibilität bieten, um alle Schlüsselparameter für erweiterte Projektionen zu ändern.
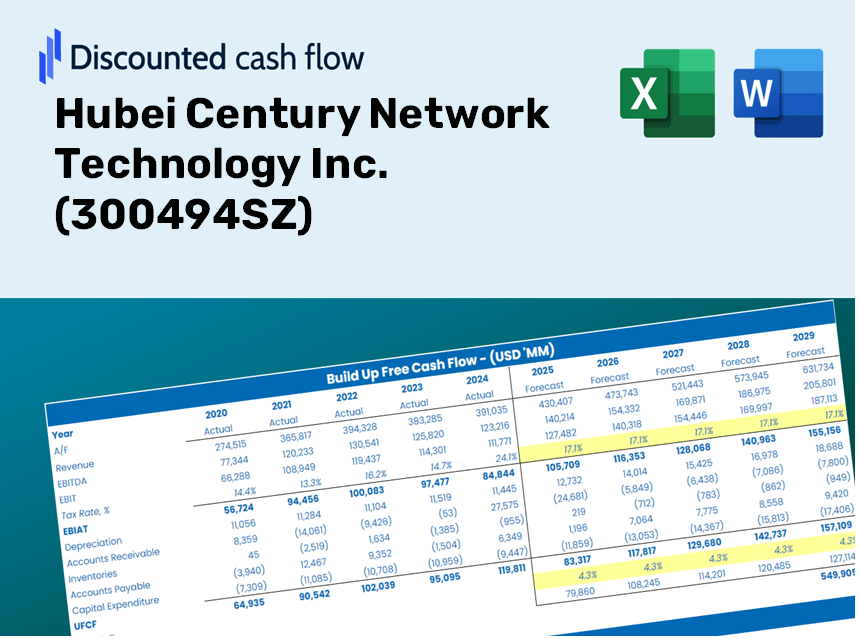
Discounted Cash Flow (DCF) - (USD MM)
| Year | AY1 2020 |
AY2 2021 |
AY3 2022 |
AY4 2023 |
AY5 2024 |
FY1 2025 |
FY2 2026 |
FY3 2027 |
FY4 2028 |
FY5 2029 |
|---|---|---|---|---|---|---|---|---|---|---|
| Revenue | 895.9 | 1,220.8 | 1,658.2 | 1,329.2 | 1,135.7 | 1,242.7 | 1,359.9 | 1,488.1 | 1,628.3 | 1,781.8 |
| Revenue Growth, % | 0 | 36.27 | 35.83 | -19.84 | -14.56 | 9.43 | 9.43 | 9.43 | 9.43 | 9.43 |
| EBITDA | 113.7 | 167.6 | 286.6 | 219.1 | -258.6 | 93.0 | 101.8 | 111.4 | 121.9 | 133.3 |
| EBITDA, % | 12.69 | 13.73 | 17.29 | 16.49 | -22.77 | 7.48 | 7.48 | 7.48 | 7.48 | 7.48 |
| Depreciation | 26.9 | 25.4 | 34.1 | 32.2 | 21.6 | 28.5 | 31.2 | 34.1 | 37.3 | 40.8 |
| Depreciation, % | 3 | 2.08 | 2.06 | 2.42 | 1.9 | 2.29 | 2.29 | 2.29 | 2.29 | 2.29 |
| EBIT | 86.8 | 142.3 | 252.5 | 186.9 | -280.2 | 64.5 | 70.6 | 77.2 | 84.5 | 92.5 |
| EBIT, % | 9.69 | 11.65 | 15.23 | 14.06 | -24.68 | 5.19 | 5.19 | 5.19 | 5.19 | 5.19 |
| Total Cash | 698.2 | 1,017.4 | 1,198.6 | 1,305.1 | 1,039.7 | 1,052.1 | 1,151.2 | 1,259.7 | 1,378.5 | 1,508.4 |
| Total Cash, percent | .0 | .0 | .0 | .0 | .0 | .0 | .0 | .0 | .0 | .0 |
| Account Receivables | 227.0 | 297.1 | 291.0 | 93.0 | 168.6 | 221.4 | 242.3 | 265.1 | 290.1 | 317.4 |
| Account Receivables, % | 25.34 | 24.34 | 17.55 | 7 | 14.84 | 17.81 | 17.81 | 17.81 | 17.81 | 17.81 |
| Inventories | .1 | 20.0 | .3 | .9 | 1.0 | 4.5 | 4.9 | 5.4 | 5.9 | 6.5 |
| Inventories, % | 0.0082979 | 1.64 | 0.01534373 | 0.06611728 | 0.08815384 | 0.36355 | 0.36355 | 0.36355 | 0.36355 | 0.36355 |
| Accounts Payable | 174.3 | 268.8 | 198.7 | 115.4 | 101.1 | 176.6 | 193.2 | 211.4 | 231.4 | 253.2 |
| Accounts Payable, % | 19.46 | 22.02 | 11.98 | 8.68 | 8.9 | 14.21 | 14.21 | 14.21 | 14.21 | 14.21 |
| Capital Expenditure | -48.8 | -41.6 | -17.2 | -38.7 | -47.4 | -42.2 | -46.2 | -50.5 | -55.3 | -60.5 |
| Capital Expenditure, % | -5.45 | -3.41 | -1.04 | -2.91 | -4.17 | -3.4 | -3.4 | -3.4 | -3.4 | -3.4 |
| Tax Rate, % | 7.08 | 7.08 | 7.08 | 7.08 | 7.08 | 7.08 | 7.08 | 7.08 | 7.08 | 7.08 |
| EBITAT | 61.2 | 126.4 | 222.7 | 169.2 | -260.4 | 55.6 | 60.9 | 66.6 | 72.9 | 79.7 |
| Depreciation | ||||||||||
| Changes in Account Receivables | ||||||||||
| Changes in Inventories | ||||||||||
| Changes in Accounts Payable | ||||||||||
| Capital Expenditure | ||||||||||
| UFCF | -13.5 | 114.6 | 195.4 | 276.8 | -376.1 | 61.1 | 41.2 | 45.1 | 49.3 | 54.0 |
| WACC, % | 8.75 | 8.75 | 8.75 | 8.75 | 8.75 | 8.75 | 8.75 | 8.75 | 8.75 | 8.75 |
| PV UFCF | ||||||||||
| SUM PV UFCF | 196.8 | |||||||||
| Long Term Growth Rate, % | 3.50 | |||||||||
| Free cash flow (T + 1) | 56 | |||||||||
| Terminal Value | 1,065 | |||||||||
| Present Terminal Value | 700 | |||||||||
| Enterprise Value | 897 | |||||||||
| Net Debt | -1,019 | |||||||||
| Equity Value | 1,916 | |||||||||
| Diluted Shares Outstanding, MM | 490 | |||||||||
| Equity Value Per Share | 3.91 |
What You Will Receive
- Authentic Hubei Century Data: Comprehensive financials – from revenue to EBIT – derived from both actual and projected figures.
- Complete Customization: Modify all essential parameters (yellow cells) such as WACC, growth %, and tax rates.
- Immediate Valuation Updates: Automatic recalculations to evaluate the effects of changes on Hubei Century's fair value.
- Flexible Excel Template: Designed for quick modifications, scenario analyses, and detailed forecasting.
- Efficient and Precise: Eliminate the need to build models from the ground up while ensuring accuracy and adaptability.
Key Features
- Pre-Loaded Data: Hubei Century Network Technology Inc.'s historical financial statements and pre-filled forecasts.
- Fully Adjustable Inputs: Customize WACC, tax rates, revenue growth, and EBITDA margins.
- Instant Results: Watch Hubei Century Network Technology Inc.'s intrinsic value update in real time.
- Clear Visual Outputs: Dashboard charts illustrate valuation results and key metrics.
- Built for Accuracy: A professional tool designed for analysts, investors, and finance experts.
How It Functions
- Download: Obtain the pre-configured Excel file containing Hubei Century Network Technology Inc.'s (300494SZ) financial data.
- Customize: Tailor forecasts, including revenue growth, EBITDA %, and WACC to your preferences.
- Update Automatically: Enjoy real-time updates for intrinsic value and NPV calculations.
- Test Scenarios: Develop various projections and quickly compare results.
- Make Decisions: Leverage the valuation insights to inform your investment strategy.
Why Select This Calculator?
- User-Friendly Interface: Crafted for both novices and seasoned experts.
- Customizable Parameters: Effortlessly adjust inputs to suit your specific analysis.
- Real-Time Updates: Instantly view how changes affect Hubei Century Network Technology Inc.'s valuation.
- Pre-Loaded Data: Comes equipped with Hubei Century's actual financial information for swift evaluations.
- Relied Upon by Experts: Employed by investors and analysts for well-informed decision-making.
Who Should Utilize This Product?
- Individual Investors: Make informed decisions regarding buying or selling Hubei Century Network Technology Inc. (300494SZ) stock.
- Financial Analysts: Enhance valuation workflows with ready-to-use financial models specific to Hubei Century Network Technology Inc. (300494SZ).
- Consultants: Provide clients with professional valuation insights on Hubei Century Network Technology Inc. (300494SZ) quickly and accurately.
- Business Owners: Gain insights into how large companies like Hubei Century Network Technology Inc. (300494SZ) are valued to inform your own business strategies.
- Finance Students: Explore valuation techniques using real-world data and scenarios related to Hubei Century Network Technology Inc. (300494SZ).
Contents of the Template
- Pre-Filled Data: Contains Hubei Century Network Technology Inc.'s historical financials and projections.
- Discounted Cash Flow Model: An editable DCF valuation model featuring automated calculations.
- Weighted Average Cost of Capital (WACC): A specific sheet for computing WACC with customizable inputs.
- Key Financial Ratios: Evaluate Hubei Century's profitability, efficiency, and leverage.
- Customizable Inputs: Easily modify revenue growth, margins, and tax rates.
- Clear Dashboard: Visuals and tables that summarize crucial valuation outcomes.
Disclaimer
All information, articles, and product details provided on this website are for general informational and educational purposes only. We do not claim any ownership over, nor do we intend to infringe upon, any trademarks, copyrights, logos, brand names, or other intellectual property mentioned or depicted on this site. Such intellectual property remains the property of its respective owners, and any references here are made solely for identification or informational purposes, without implying any affiliation, endorsement, or partnership.
We make no representations or warranties, express or implied, regarding the accuracy, completeness, or suitability of any content or products presented. Nothing on this website should be construed as legal, tax, investment, financial, medical, or other professional advice. In addition, no part of this site—including articles or product references—constitutes a solicitation, recommendation, endorsement, advertisement, or offer to buy or sell any securities, franchises, or other financial instruments, particularly in jurisdictions where such activity would be unlawful.
All content is of a general nature and may not address the specific circumstances of any individual or entity. It is not a substitute for professional advice or services. Any actions you take based on the information provided here are strictly at your own risk. You accept full responsibility for any decisions or outcomes arising from your use of this website and agree to release us from any liability in connection with your use of, or reliance upon, the content or products found herein.