
|
Wens Foodstuff Group Co., Ltd. (300498.sz) DCF -Bewertung |
Fully Editable: Tailor To Your Needs In Excel Or Sheets
Professional Design: Trusted, Industry-Standard Templates
Investor-Approved Valuation Models
MAC/PC Compatible, Fully Unlocked
No Expertise Is Needed; Easy To Follow
Wens Foodstuff Group Co., Ltd. (300498.SZ) Bundle
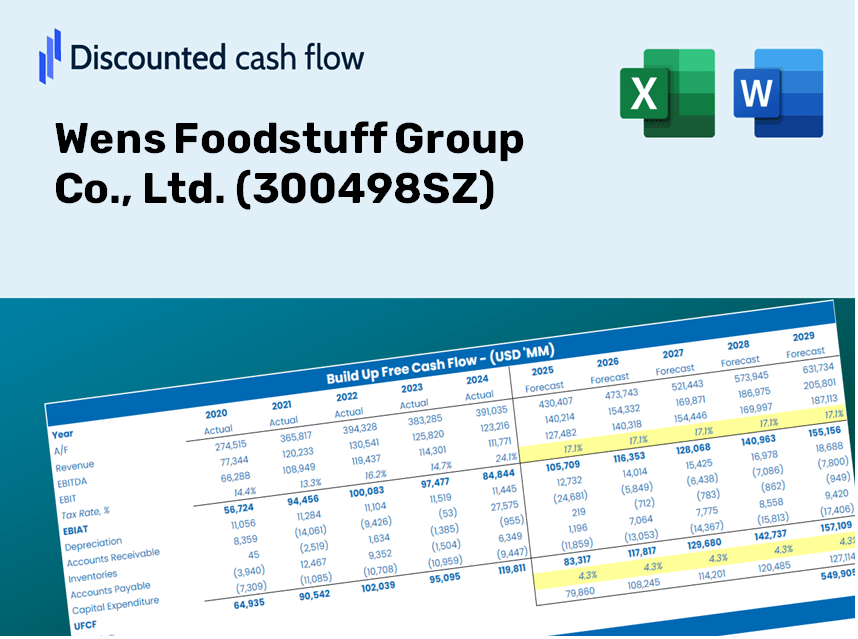
Gewinnen Sie Einblicke in Ihre Wens Foodstuff Group Co., Ltd. (300498SZ) Bewertungsanalyse mit unserem ausgeklügelten DCF -Taschenrechner! Diese Excel -Vorlage wird mit tatsächlichen (300498SZ) Daten vorinstalliert, sodass Sie die Vorhersagen und Annahmen für eine genaue Berechnung von Wens Foodstuff Group Co., Ltd., anpassen können.
What You'll Receive
- Accurate Wens Financial Data: Access to both historical and projected figures for precise valuation.
- Customizable Variables: Adjust WACC, tax rates, revenue growth, and capital expenditures as needed.
- Automated Calculations: Dynamic computation of intrinsic value and NPV.
- Scenario Analysis: Explore various scenarios to assess the future performance of Wens Foodstuff Group (300498SZ).
- User-Friendly Interface: Designed for industry professionals while remaining approachable for newcomers.
Key Features
- 🔍 Real-Life Wens Financials: Pre-filled historical and projected data for Wens Foodstuff Group Co., Ltd. (300498SZ).
- ✏️ Fully Customizable Inputs: Modify all essential parameters (yellow cells) such as WACC, growth %, and tax rates.
- 📊 Professional DCF Valuation: Integrated formulas assess Wens' intrinsic value using the Discounted Cash Flow method.
- ⚡ Instant Results: Visualize Wens' valuation immediately after adjustments.
- Scenario Analysis: Evaluate and compare various financial scenarios side-by-side.
How It Functions
- Step 1: Download the Excel spreadsheet.
- Step 2: Examine the pre-filled Wens Foodstuff Group Co., Ltd. (300498SZ) data (historical and estimated).
- Step 3: Modify key assumptions (highlighted in yellow) based on your evaluation.
- Step 4: Observe real-time updates on Wens Foodstuff's intrinsic value.
- Step 5: Leverage the results for investment choices or financial reporting.
Why Choose This Calculator?
- Designed for Experts: A sophisticated tool tailored for analysts, CFOs, and consultants in the food industry.
- Accurate Data: Wens Foodstuff Group's historical and projected financials are preloaded for precise analysis.
- Flexible Scenario Analysis: Effortlessly test various forecasts and assumptions to explore different outcomes.
- Comprehensive Outputs: Automatically computes intrinsic value, NPV, and other critical metrics for informed decision-making.
- User-Friendly: Clear, step-by-step guidance ensures a smooth experience throughout the calculation process.
Who Should Benefit from This Product?
- Investors: Accurately assess Wens Foodstuff Group Co., Ltd.'s (300498SZ) fair value prior to making investment choices.
- CFOs: Utilize a high-quality DCF model for financial reporting and comprehensive analysis.
- Consultants: Easily customize the template for valuation reports tailored to clients.
- Entrepreneurs: Acquire insights into financial modeling practices employed by leading companies.
- Educators: Implement it as a resource to teach valuation techniques and methodologies.
Contents of the Template
- Detailed DCF Model: An editable template featuring comprehensive valuation computations.
- Actual Financial Data: Wens Foodstuff Group Co., Ltd. (300498SZ) includes its historical and projected financials for thorough analysis.
- Adjustable Variables: Modify WACC, growth rates, and tax assumptions to explore different scenarios.
- Financial Statements: Complete annual and quarterly reports for enhanced understanding.
- Important Ratios: Integrated analysis for assessing profitability, efficiency, and leverage metrics.
- Interactive Dashboard: Visual graphics and tables to present clear and actionable insights.
Disclaimer
All information, articles, and product details provided on this website are for general informational and educational purposes only. We do not claim any ownership over, nor do we intend to infringe upon, any trademarks, copyrights, logos, brand names, or other intellectual property mentioned or depicted on this site. Such intellectual property remains the property of its respective owners, and any references here are made solely for identification or informational purposes, without implying any affiliation, endorsement, or partnership.
We make no representations or warranties, express or implied, regarding the accuracy, completeness, or suitability of any content or products presented. Nothing on this website should be construed as legal, tax, investment, financial, medical, or other professional advice. In addition, no part of this site—including articles or product references—constitutes a solicitation, recommendation, endorsement, advertisement, or offer to buy or sell any securities, franchises, or other financial instruments, particularly in jurisdictions where such activity would be unlawful.
All content is of a general nature and may not address the specific circumstances of any individual or entity. It is not a substitute for professional advice or services. Any actions you take based on the information provided here are strictly at your own risk. You accept full responsibility for any decisions or outcomes arising from your use of this website and agree to release us from any liability in connection with your use of, or reliance upon, the content or products found herein.