
|
China Harzone Industry Corp., Ltd (300527.sz) DCF -Bewertung |
Fully Editable: Tailor To Your Needs In Excel Or Sheets
Professional Design: Trusted, Industry-Standard Templates
Investor-Approved Valuation Models
MAC/PC Compatible, Fully Unlocked
No Expertise Is Needed; Easy To Follow
China Harzone Industry Corp., Ltd (300527.SZ) Bundle
Bewerten Sie die finanziellen Aussichten der China Harzone Industry Corp., Ltd wie ein Profi! Dieser DCF-Taschenrechner (300527SZ) liefert vorgefüllte Finanzdaten sowie die Gesamtflexibilität, um das Umsatzwachstum, WACC, Margen und andere wesentliche Annahmen zu ändern, um sich mit Ihren Vorhersagen auszurichten.
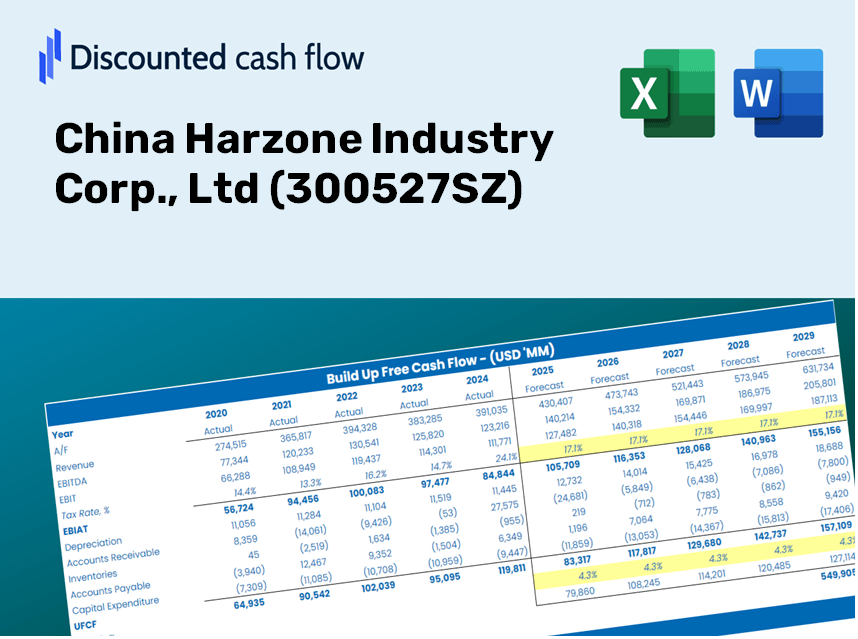
Discounted Cash Flow (DCF) - (USD MM)
| Year | AY1 2020 |
AY2 2021 |
AY3 2022 |
AY4 2023 |
AY5 2024 |
FY1 2025 |
FY2 2026 |
FY3 2027 |
FY4 2028 |
FY5 2029 |
|---|---|---|---|---|---|---|---|---|---|---|
| Revenue | 1,821.3 | 1,698.4 | 1,658.1 | 603.1 | 1,161.1 | 1,218.4 | 1,278.6 | 1,341.8 | 1,408.1 | 1,477.7 |
| Revenue Growth, % | 0 | -6.75 | -2.37 | -63.63 | 92.51 | 4.94 | 4.94 | 4.94 | 4.94 | 4.94 |
| EBITDA | 182.9 | 138.8 | 93.6 | -139.5 | 84.8 | 19.6 | 20.5 | 21.6 | 22.6 | 23.7 |
| EBITDA, % | 10.04 | 8.17 | 5.65 | -23.13 | 7.3 | 1.61 | 1.61 | 1.61 | 1.61 | 1.61 |
| Depreciation | 57.6 | 53.9 | 58.4 | 51.6 | 57.3 | 56.9 | 59.7 | 62.6 | 65.7 | 69.0 |
| Depreciation, % | 3.16 | 3.17 | 3.52 | 8.55 | 4.94 | 4.67 | 4.67 | 4.67 | 4.67 | 4.67 |
| EBIT | 125.3 | 84.9 | 35.2 | -191.1 | 27.5 | -37.3 | -39.1 | -41.1 | -43.1 | -45.2 |
| EBIT, % | 6.88 | 5 | 2.12 | -31.68 | 2.37 | -3.06 | -3.06 | -3.06 | -3.06 | -3.06 |
| Total Cash | 2,000.9 | 1,672.1 | 1,794.1 | 1,630.9 | 1,423.1 | 1,214.7 | 1,274.7 | 1,337.6 | 1,403.7 | 1,473.1 |
| Total Cash, percent | .0 | .0 | .0 | .0 | .0 | .0 | .0 | .0 | .0 | .0 |
| Account Receivables | 595.9 | 992.6 | 1,202.7 | 544.5 | 761.9 | 778.8 | 817.3 | 857.7 | 900.1 | 944.5 |
| Account Receivables, % | 32.72 | 58.44 | 72.54 | 90.28 | 65.62 | 63.92 | 63.92 | 63.92 | 63.92 | 63.92 |
| Inventories | 266.0 | 377.8 | 377.6 | 244.8 | 158.7 | 277.5 | 291.2 | 305.6 | 320.7 | 336.6 |
| Inventories, % | 14.6 | 22.24 | 22.77 | 40.59 | 13.67 | 22.78 | 22.78 | 22.78 | 22.78 | 22.78 |
| Accounts Payable | 688.4 | 789.0 | 923.0 | 429.2 | 459.7 | 610.9 | 641.0 | 672.7 | 705.9 | 740.8 |
| Accounts Payable, % | 37.8 | 46.46 | 55.66 | 71.16 | 39.59 | 50.13 | 50.13 | 50.13 | 50.13 | 50.13 |
| Capital Expenditure | -75.2 | -62.4 | -44.2 | -147.2 | -36.0 | -92.6 | -97.1 | -101.9 | -107.0 | -112.3 |
| Capital Expenditure, % | -4.13 | -3.68 | -2.67 | -24.41 | -3.1 | -7.6 | -7.6 | -7.6 | -7.6 | -7.6 |
| Tax Rate, % | 38.71 | 38.71 | 38.71 | 38.71 | 38.71 | 38.71 | 38.71 | 38.71 | 38.71 | 38.71 |
| EBITAT | 89.7 | 72.1 | -15.1 | -196.1 | 16.9 | -23.7 | -24.9 | -26.1 | -27.4 | -28.7 |
| Depreciation | ||||||||||
| Changes in Account Receivables | ||||||||||
| Changes in Inventories | ||||||||||
| Changes in Accounts Payable | ||||||||||
| Capital Expenditure | ||||||||||
| UFCF | -101.4 | -344.3 | -77.0 | 5.4 | -62.7 | -43.9 | -84.3 | -88.5 | -92.9 | -97.5 |
| WACC, % | 6.07 | 6.09 | 5.93 | 6.12 | 6.05 | 6.05 | 6.05 | 6.05 | 6.05 | 6.05 |
| PV UFCF | ||||||||||
| SUM PV UFCF | -336.6 | |||||||||
| Long Term Growth Rate, % | 4.00 | |||||||||
| Free cash flow (T + 1) | -101 | |||||||||
| Terminal Value | -4,938 | |||||||||
| Present Terminal Value | -3,681 | |||||||||
| Enterprise Value | -4,017 | |||||||||
| Net Debt | -1,202 | |||||||||
| Equity Value | -2,815 | |||||||||
| Diluted Shares Outstanding, MM | 864 | |||||||||
| Equity Value Per Share | -3.26 |
What You Will Receive
- Adjustable Forecast Parameters: Seamlessly modify assumptions (growth %, margins, WACC) to explore various scenarios.
- Authentic Data: Pre-filled financial data for China Harzone Industry Corp., Ltd (300527SZ) to kickstart your analysis.
- Automated DCF Calculations: The template computes Net Present Value (NPV) and intrinsic value for you automatically.
- Versatile and Professional Design: A refined Excel model that caters to your valuation requirements.
- Tailored for Analysts and Investors: Perfect for evaluating projections, validating strategies, and enhancing efficiency.
Key Features
- Comprehensive CHZ Financials: Pre-loaded with China Harzone Industry Corp., Ltd's historical financial data and future projections.
- Flexible Input Options: Tailor revenue growth, profit margins, WACC, tax rates, and capital expenditures to your needs.
- Responsive Valuation Model: Instant updates to Net Present Value (NPV) and intrinsic value based on your customized inputs.
- Scenario Analysis: Develop various forecasting scenarios to evaluate differing valuation results.
- Intuitive Interface: Designed for ease of use, suitable for both professionals and newcomers.
How It Functions
- Download: Obtain the pre-prepared Excel file containing China Harzone Industry Corp., Ltd’s financial data (300527SZ).
- Customize: Modify forecasts such as revenue growth, EBITDA %, and WACC to fit your analysis.
- Update Automatically: Enjoy real-time updates for the intrinsic value and NPV calculations.
- Test Scenarios: Develop various projections and swiftly compare their outcomes.
- Make Decisions: Utilize the valuation results to inform your investment strategies.
Why Opt for the China Harzone Industry Corp., Ltd (300527SZ) Calculator?
- Time-Efficient: Start analyzing immediately without the need to build a DCF model from the ground up.
- Enhanced Accuracy: Dependable financial data and formulas minimize valuation errors.
- Fully Adaptable: Customize the model to align with your specific assumptions and forecasts.
- User-Friendly: Intuitive charts and outputs facilitate easy interpretation of results.
- Expert-Endorsed: Crafted for professionals who prioritize precision and usability.
Who Can Benefit from This Product?
- Professional Investors: Develop comprehensive and trustworthy valuation models for assessing investments in China Harzone Industry Corp., Ltd (300527SZ).
- Corporate Finance Teams: Evaluate valuation scenarios to inform strategic decision-making within the company.
- Consultants and Advisors: Deliver precise valuation insights to clients interested in China Harzone Industry Corp., Ltd (300527SZ).
- Students and Educators: Utilize real-world data to enhance learning and practice in financial modeling.
- Industry Enthusiasts: Gain an understanding of how companies like China Harzone Industry Corp., Ltd (300527SZ) are valued in the marketplace.
Contents of the Template
- Comprehensive DCF Model: Editable template featuring in-depth valuation calculations.
- Real-World Data: Historical and projected financial information for China Harzone Industry Corp., Ltd (300527SZ) preloaded for analysis.
- Customizable Parameters: Modify WACC, growth rates, and tax assumptions to explore different scenarios.
- Financial Statements: Complete annual and quarterly breakdowns for enhanced insights.
- Key Ratios: Integrated analysis for profitability, efficiency, and leverage metrics.
- Dashboard with Visual Outputs: Charts and tables that present clear, actionable insights.
Disclaimer
All information, articles, and product details provided on this website are for general informational and educational purposes only. We do not claim any ownership over, nor do we intend to infringe upon, any trademarks, copyrights, logos, brand names, or other intellectual property mentioned or depicted on this site. Such intellectual property remains the property of its respective owners, and any references here are made solely for identification or informational purposes, without implying any affiliation, endorsement, or partnership.
We make no representations or warranties, express or implied, regarding the accuracy, completeness, or suitability of any content or products presented. Nothing on this website should be construed as legal, tax, investment, financial, medical, or other professional advice. In addition, no part of this site—including articles or product references—constitutes a solicitation, recommendation, endorsement, advertisement, or offer to buy or sell any securities, franchises, or other financial instruments, particularly in jurisdictions where such activity would be unlawful.
All content is of a general nature and may not address the specific circumstances of any individual or entity. It is not a substitute for professional advice or services. Any actions you take based on the information provided here are strictly at your own risk. You accept full responsibility for any decisions or outcomes arising from your use of this website and agree to release us from any liability in connection with your use of, or reliance upon, the content or products found herein.