
|
Jafron Biomedical Co., Ltd. (300529.SZ) DCF -Bewertung |
Fully Editable: Tailor To Your Needs In Excel Or Sheets
Professional Design: Trusted, Industry-Standard Templates
Investor-Approved Valuation Models
MAC/PC Compatible, Fully Unlocked
No Expertise Is Needed; Easy To Follow
Jafron Biomedical Co.,Ltd. (300529.SZ) Bundle
Entdecken Sie die finanzielle Zukunft von Jafron Biomedical Co., Ltd. mit unserem benutzerfreundlichen DCF-Taschenrechner! Geben Sie Ihre Prognosen für Wachstum, Margen und Kosten ein, um den inneren Wert von Jafron Biomedical Co., Ltd., zu berechnen, und formen Sie Ihren Investitionsansatz.
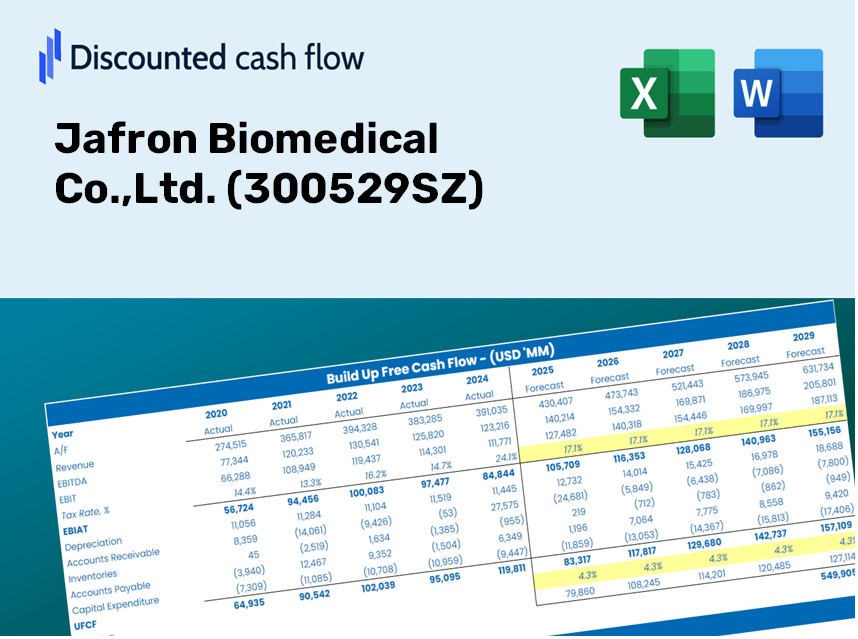
Discounted Cash Flow (DCF) - (USD MM)
| Year | AY1 2020 |
AY2 2021 |
AY3 2022 |
AY4 2023 |
AY5 2024 |
FY1 2025 |
FY2 2026 |
FY3 2027 |
FY4 2028 |
FY5 2029 |
|---|---|---|---|---|---|---|---|---|---|---|
| Revenue | 1,950.8 | 2,675.5 | 2,491.4 | 1,922.3 | 2,677.3 | 2,929.4 | 3,205.1 | 3,506.8 | 3,836.9 | 4,198.1 |
| Revenue Growth, % | 0 | 37.15 | -6.88 | -22.84 | 39.27 | 9.41 | 9.41 | 9.41 | 9.41 | 9.41 |
| EBITDA | 1,002.2 | 1,373.0 | 995.7 | 573.4 | 1,119.7 | 1,255.6 | 1,373.8 | 1,503.1 | 1,644.6 | 1,799.4 |
| EBITDA, % | 51.38 | 51.32 | 39.97 | 29.83 | 41.82 | 42.86 | 42.86 | 42.86 | 42.86 | 42.86 |
| Depreciation | 36.7 | 49.2 | 69.1 | 90.4 | 121.7 | 92.2 | 100.9 | 110.4 | 120.8 | 132.2 |
| Depreciation, % | 1.88 | 1.84 | 2.77 | 4.7 | 4.55 | 3.15 | 3.15 | 3.15 | 3.15 | 3.15 |
| EBIT | 965.5 | 1,323.8 | 926.7 | 483.0 | 998.0 | 1,163.3 | 1,272.9 | 1,392.7 | 1,523.8 | 1,667.2 |
| EBIT, % | 49.49 | 49.48 | 37.19 | 25.12 | 37.28 | 39.71 | 39.71 | 39.71 | 39.71 | 39.71 |
| Total Cash | 1,575.0 | 2,469.5 | 2,558.8 | 2,810.3 | 2,317.8 | 2,692.7 | 2,946.2 | 3,223.6 | 3,527.0 | 3,859.0 |
| Total Cash, percent | .0 | .0 | .0 | .0 | .0 | .0 | .0 | .0 | .0 | .0 |
| Account Receivables | 215.8 | 308.1 | 239.6 | .0 | 59.3 | 201.6 | 220.6 | 241.3 | 264.0 | 288.9 |
| Account Receivables, % | 11.06 | 11.51 | 9.62 | 0 | 2.21 | 6.88 | 6.88 | 6.88 | 6.88 | 6.88 |
| Inventories | 120.7 | 196.5 | 349.1 | 385.0 | 337.8 | 352.6 | 385.8 | 422.1 | 461.9 | 505.4 |
| Inventories, % | 6.19 | 7.35 | 14.01 | 20.03 | 12.62 | 12.04 | 12.04 | 12.04 | 12.04 | 12.04 |
| Accounts Payable | 50.2 | 60.8 | 128.5 | 135.6 | 119.2 | 126.0 | 137.9 | 150.9 | 165.1 | 180.6 |
| Accounts Payable, % | 2.57 | 2.27 | 5.16 | 7.06 | 4.45 | 4.3 | 4.3 | 4.3 | 4.3 | 4.3 |
| Capital Expenditure | -357.1 | -537.4 | -475.9 | -247.3 | -235.1 | -463.6 | -507.3 | -555.1 | -607.3 | -664.5 |
| Capital Expenditure, % | -18.31 | -20.09 | -19.1 | -12.86 | -8.78 | -15.83 | -15.83 | -15.83 | -15.83 | -15.83 |
| Tax Rate, % | 18.55 | 18.55 | 18.55 | 18.55 | 18.55 | 18.55 | 18.55 | 18.55 | 18.55 | 18.55 |
| EBITAT | 818.9 | 1,125.9 | 810.7 | 404.6 | 812.9 | 983.2 | 1,075.8 | 1,177.0 | 1,287.8 | 1,409.1 |
| Depreciation | ||||||||||
| Changes in Account Receivables | ||||||||||
| Changes in Inventories | ||||||||||
| Changes in Accounts Payable | ||||||||||
| Capital Expenditure | ||||||||||
| UFCF | 212.2 | 480.1 | 387.5 | 458.7 | 670.9 | 461.5 | 629.1 | 688.3 | 753.1 | 824.0 |
| WACC, % | 5.39 | 5.39 | 5.39 | 5.38 | 5.37 | 5.38 | 5.38 | 5.38 | 5.38 | 5.38 |
| PV UFCF | ||||||||||
| SUM PV UFCF | 2,837.0 | |||||||||
| Long Term Growth Rate, % | 2.00 | |||||||||
| Free cash flow (T + 1) | 840 | |||||||||
| Terminal Value | 24,837 | |||||||||
| Present Terminal Value | 19,108 | |||||||||
| Enterprise Value | 21,945 | |||||||||
| Net Debt | -532 | |||||||||
| Equity Value | 22,477 | |||||||||
| Diluted Shares Outstanding, MM | 767 | |||||||||
| Equity Value Per Share | 29.32 |
Benefits You Will Receive
- Genuine Jafron Financial Data: Pre-loaded with Jafron’s historical and forecasted figures for accurate analysis.
- Customizable Template: Easily adjust key metrics such as revenue growth, WACC, and EBITDA percentage.
- Instant Calculations: Watch Jafron’s intrinsic value update live as you make changes.
- Expert Valuation Tool: Tailored for investors, analysts, and consultants seeking precise DCF valuations.
- Intuitive Interface: Straightforward layout and clear guidance suitable for all skill levels.
Key Features
- Accurate Jafron Financial Data: Pre-loaded with Jafron Biomedical Co., Ltd.'s historical performance metrics and future projections.
- Comprehensive Input Customization: Easily modify revenue growth, profit margins, WACC, tax rates, and capital expenditures.
- Interactive Valuation Model: Real-time updates to Net Present Value (NPV) and intrinsic value based on your customized inputs.
- Scenario Analysis: Develop various forecast scenarios to evaluate different valuation possibilities.
- Intuitive User Experience: Designed to be straightforward and accessible for both industry professionals and novices.
How It Functions
- Step 1: Download the Excel spreadsheet.
- Step 2: Examine the pre-filled Jafron Biomedical data (historical and projected).
- Step 3: Modify key assumptions (highlighted in yellow) according to your analysis.
- Step 4: Observe automatic updates for Jafron’s intrinsic value.
- Step 5: Utilize the results for investment analysis or reporting purposes.
Why Choose Jafron Biomedical’s Calculator?
- All-in-One Solution: Combines DCF, WACC, and financial ratio analyses for comprehensive evaluation.
- Flexible Parameters: Modify the highlighted cells to explore different financial scenarios.
- In-Depth Analysis: Automatically computes Jafron’s intrinsic value and Net Present Value.
- Integrated Data: Features historical and forecasted information for reliable baselines.
- Designed for Professionals: Tailored for financial analysts, investors, and business consultants in the biomedical sector.
Who Can Benefit from This Product?
- Investors: Evaluate Jafron Biomedical Co.,Ltd.'s ([300529SZ]) market position before making stock decisions.
- CFOs and Financial Analysts: Optimize valuation methods and assess financial projections.
- Startup Founders: Understand the valuation process of established companies like Jafron Biomedical ([300529SZ]).
- Consultants: Provide clients with detailed and accurate valuation reports.
- Students and Educators: Utilize authentic data to learn and teach valuation strategies.
Contents of the Template
- Preloaded Jafron Data: Historical and forecasted financial metrics, including revenue, EBIT, and capital expenditures.
- DCF and WACC Models: High-quality spreadsheets for determining intrinsic value and Weighted Average Cost of Capital.
- Editable Inputs: Cells highlighted in yellow for modifying revenue growth, tax rates, and discount rates.
- Financial Statements: Detailed annual and quarterly financial reports for in-depth analysis.
- Key Ratios: Ratios assessing profitability, leverage, and efficiency to gauge performance.
- Dashboard and Charts: Visual representations of valuation results and underlying assumptions.
Disclaimer
All information, articles, and product details provided on this website are for general informational and educational purposes only. We do not claim any ownership over, nor do we intend to infringe upon, any trademarks, copyrights, logos, brand names, or other intellectual property mentioned or depicted on this site. Such intellectual property remains the property of its respective owners, and any references here are made solely for identification or informational purposes, without implying any affiliation, endorsement, or partnership.
We make no representations or warranties, express or implied, regarding the accuracy, completeness, or suitability of any content or products presented. Nothing on this website should be construed as legal, tax, investment, financial, medical, or other professional advice. In addition, no part of this site—including articles or product references—constitutes a solicitation, recommendation, endorsement, advertisement, or offer to buy or sell any securities, franchises, or other financial instruments, particularly in jurisdictions where such activity would be unlawful.
All content is of a general nature and may not address the specific circumstances of any individual or entity. It is not a substitute for professional advice or services. Any actions you take based on the information provided here are strictly at your own risk. You accept full responsibility for any decisions or outcomes arising from your use of this website and agree to release us from any liability in connection with your use of, or reliance upon, the content or products found herein.