
|
Brilliance Technology Co., Ltd. (300542.Sz) DCF -Bewertung |
Fully Editable: Tailor To Your Needs In Excel Or Sheets
Professional Design: Trusted, Industry-Standard Templates
Investor-Approved Valuation Models
MAC/PC Compatible, Fully Unlocked
No Expertise Is Needed; Easy To Follow
Brilliance Technology Co., Ltd. (300542.SZ) Bundle
Egal, ob Sie ein Investor oder Analyst sind, dieser [300542SZ] DCF-Taschenrechner ist Ihre Anlaufstelle für eine genaue Bewertung. Mit realen Daten von Brilliance Technology Co., Ltd., können Sie Prognosen anpassen und die Auswirkungen sofort beobachten.
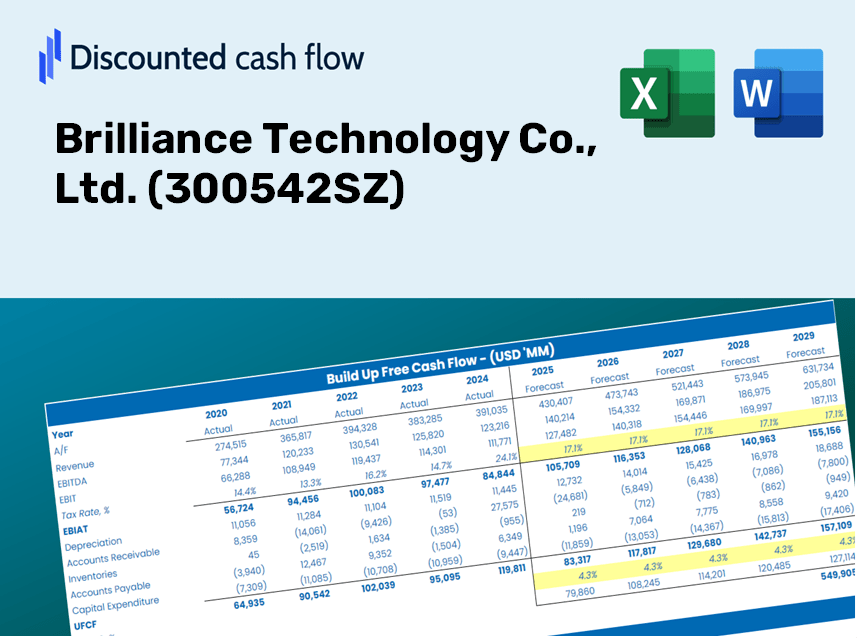
Discounted Cash Flow (DCF) - (USD MM)
| Year | AY1 2020 |
AY2 2021 |
AY3 2022 |
AY4 2023 |
AY5 2024 |
FY1 2025 |
FY2 2026 |
FY3 2027 |
FY4 2028 |
FY5 2029 |
|---|---|---|---|---|---|---|---|---|---|---|
| Revenue | 1,149.2 | 1,061.1 | 1,455.0 | 1,735.0 | 1,349.5 | 1,438.8 | 1,534.1 | 1,635.7 | 1,744.0 | 1,859.4 |
| Revenue Growth, % | 0 | -7.66 | 37.12 | 19.24 | -22.22 | 6.62 | 6.62 | 6.62 | 6.62 | 6.62 |
| EBITDA | 113.7 | 91.9 | 82.0 | 63.0 | -65.5 | 66.1 | 70.5 | 75.1 | 80.1 | 85.4 |
| EBITDA, % | 9.89 | 8.66 | 5.63 | 3.63 | -4.85 | 4.59 | 4.59 | 4.59 | 4.59 | 4.59 |
| Depreciation | 9.8 | 9.6 | 13.6 | 8.3 | 5.9 | 10.4 | 11.1 | 11.8 | 12.6 | 13.4 |
| Depreciation, % | 0.84871 | 0.90733 | 0.93599 | 0.47906 | 0.43784 | 0.72179 | 0.72179 | 0.72179 | 0.72179 | 0.72179 |
| EBIT | 103.9 | 82.2 | 68.4 | 54.7 | -71.4 | 55.7 | 59.4 | 63.3 | 67.5 | 72.0 |
| EBIT, % | 9.04 | 7.75 | 4.7 | 3.15 | -5.29 | 3.87 | 3.87 | 3.87 | 3.87 | 3.87 |
| Total Cash | 279.4 | 269.4 | 337.5 | 524.3 | 517.9 | 407.2 | 434.1 | 462.9 | 493.5 | 526.2 |
| Total Cash, percent | .0 | .0 | .0 | .0 | .0 | .0 | .0 | .0 | .0 | .0 |
| Account Receivables | 327.0 | 347.8 | 504.8 | 589.0 | 431.3 | 465.7 | 496.6 | 529.4 | 564.5 | 601.9 |
| Account Receivables, % | 28.46 | 32.77 | 34.69 | 33.95 | 31.96 | 32.37 | 32.37 | 32.37 | 32.37 | 32.37 |
| Inventories | 111.2 | 129.0 | 140.6 | 174.2 | 166.2 | 155.0 | 165.2 | 176.2 | 187.8 | 200.3 |
| Inventories, % | 9.68 | 12.15 | 9.67 | 10.04 | 12.32 | 10.77 | 10.77 | 10.77 | 10.77 | 10.77 |
| Accounts Payable | 153.2 | 141.9 | 127.6 | 332.5 | 385.4 | 239.4 | 255.3 | 272.2 | 290.2 | 309.4 |
| Accounts Payable, % | 13.33 | 13.37 | 8.77 | 19.17 | 28.56 | 16.64 | 16.64 | 16.64 | 16.64 | 16.64 |
| Capital Expenditure | -3.6 | -5.3 | -1.7 | -5.7 | -2.1 | -4.1 | -4.3 | -4.6 | -4.9 | -5.2 |
| Capital Expenditure, % | -0.31234 | -0.49871 | -0.11367 | -0.32813 | -0.15741 | -0.28205 | -0.28205 | -0.28205 | -0.28205 | -0.28205 |
| Tax Rate, % | 4.17 | 4.17 | 4.17 | 4.17 | 4.17 | 4.17 | 4.17 | 4.17 | 4.17 | 4.17 |
| EBITAT | 71.6 | 65.9 | 60.9 | 48.9 | -68.4 | 47.1 | 50.3 | 53.6 | 57.1 | 60.9 |
| Depreciation | ||||||||||
| Changes in Account Receivables | ||||||||||
| Changes in Inventories | ||||||||||
| Changes in Accounts Payable | ||||||||||
| Capital Expenditure | ||||||||||
| UFCF | -207.3 | 20.5 | -110.2 | 138.7 | 153.9 | -115.6 | 31.8 | 33.9 | 36.1 | 38.5 |
| WACC, % | 4.66 | 4.69 | 4.71 | 4.71 | 4.73 | 4.7 | 4.7 | 4.7 | 4.7 | 4.7 |
| PV UFCF | ||||||||||
| SUM PV UFCF | 8.7 | |||||||||
| Long Term Growth Rate, % | 3.00 | |||||||||
| Free cash flow (T + 1) | 40 | |||||||||
| Terminal Value | 2,333 | |||||||||
| Present Terminal Value | 1,855 | |||||||||
| Enterprise Value | 1,863 | |||||||||
| Net Debt | -290 | |||||||||
| Equity Value | 2,154 | |||||||||
| Diluted Shares Outstanding, MM | 299 | |||||||||
| Equity Value Per Share | 7.21 |
What You Will Receive
- Authentic 300542SZ Financial Data: Access both historical and projected metrics for precise valuation.
- Customizable Inputs: Adjust parameters such as WACC, tax rates, revenue growth, and capital expenditures.
- Automated Calculations: Intrinsic value and NPV are computed in real-time.
- Scenario Analysis: Explore various scenarios to assess Brilliance Technology's future performance.
- User-Friendly Design: Crafted for professionals while remaining approachable for newcomers.
Key Features
- Authentic Financial Data: Gain access to precise historical figures and future forecasts for Brilliance Technology Co., Ltd. (300542SZ).
- Adjustable Forecast Inputs: Modify highlighted cells to customize WACC, growth rates, and profit margins.
- Automated Calculations: Experience real-time updates for DCF, Net Present Value (NPV), and cash flow assessments.
- User-Friendly Dashboard: View intuitive charts and summaries to easily interpret your valuation outcomes.
- Suitable for All Levels: An organized design tailored for investors, CFOs, and consultants alike.
How It Functions
- Step 1: Download the ready-to-use Excel template featuring Brilliance Technology Co., Ltd.'s data.
- Step 2: Navigate through the pre-populated sheets to gain insights into key performance metrics.
- Step 3: Modify the forecasts and assumptions in the editable yellow cells (WACC, growth rates, and profit margins).
- Step 4: Immediately see recalculated results, including the intrinsic value of Brilliance Technology Co., Ltd. (300542SZ).
- Step 5: Use the outputs to make well-informed investment choices or create detailed reports.
Why Opt for Brilliance Technology Co., Ltd. Calculator?
- Reliable Financial Data: Up-to-date Brilliance Technology financials guarantee trustworthy valuation outcomes.
- Fully Customizable: Tailor essential parameters such as growth rates, WACC, and tax rates to fit your unique forecasts.
- Efficient: Integrated calculations save you the hassle of starting from scratch.
- Professional-Quality Tool: Created specifically for investors, analysts, and consultants.
- Easy to Use: User-friendly interface and clear step-by-step guidance ensure accessibility for all users.
Who Can Benefit from This Product?
- Investors: Accurately assess the fair value of Brilliance Technology Co., Ltd. (300542SZ) before making investment choices.
- CFOs: Utilize a professional-grade DCF model for comprehensive financial reporting and analysis.
- Consultants: Easily customize the template for client valuation reports related to (300542SZ).
- Entrepreneurs: Discover insights into financial modeling practices employed by leading tech companies.
- Educators: Employ this tool to illustrate valuation methods in academic settings.
What the Template Includes
- Pre-Filled DCF Model: Brilliance Technology Co., Ltd.'s (300542SZ) financial data preloaded for immediate application.
- WACC Calculator: Comprehensive calculations for the Weighted Average Cost of Capital.
- Financial Ratios: Assess Brilliance Technology's profitability, leverage, and operational efficiency.
- Editable Inputs: Modify assumptions such as growth rates, profit margins, and capital expenditures to tailor your analyses.
- Financial Statements: Access annual and quarterly reports to facilitate in-depth analysis.
- Interactive Dashboard: Seamlessly visualize essential valuation metrics and outcomes.
Disclaimer
All information, articles, and product details provided on this website are for general informational and educational purposes only. We do not claim any ownership over, nor do we intend to infringe upon, any trademarks, copyrights, logos, brand names, or other intellectual property mentioned or depicted on this site. Such intellectual property remains the property of its respective owners, and any references here are made solely for identification or informational purposes, without implying any affiliation, endorsement, or partnership.
We make no representations or warranties, express or implied, regarding the accuracy, completeness, or suitability of any content or products presented. Nothing on this website should be construed as legal, tax, investment, financial, medical, or other professional advice. In addition, no part of this site—including articles or product references—constitutes a solicitation, recommendation, endorsement, advertisement, or offer to buy or sell any securities, franchises, or other financial instruments, particularly in jurisdictions where such activity would be unlawful.
All content is of a general nature and may not address the specific circumstances of any individual or entity. It is not a substitute for professional advice or services. Any actions you take based on the information provided here are strictly at your own risk. You accept full responsibility for any decisions or outcomes arising from your use of this website and agree to release us from any liability in connection with your use of, or reliance upon, the content or products found herein.