
|
T & S Communications Co., Ltd. (300570.sz) DCF -Bewertung |
Fully Editable: Tailor To Your Needs In Excel Or Sheets
Professional Design: Trusted, Industry-Standard Templates
Investor-Approved Valuation Models
MAC/PC Compatible, Fully Unlocked
No Expertise Is Needed; Easy To Follow
T&S Communications Co.,Ltd. (300570.SZ) Bundle
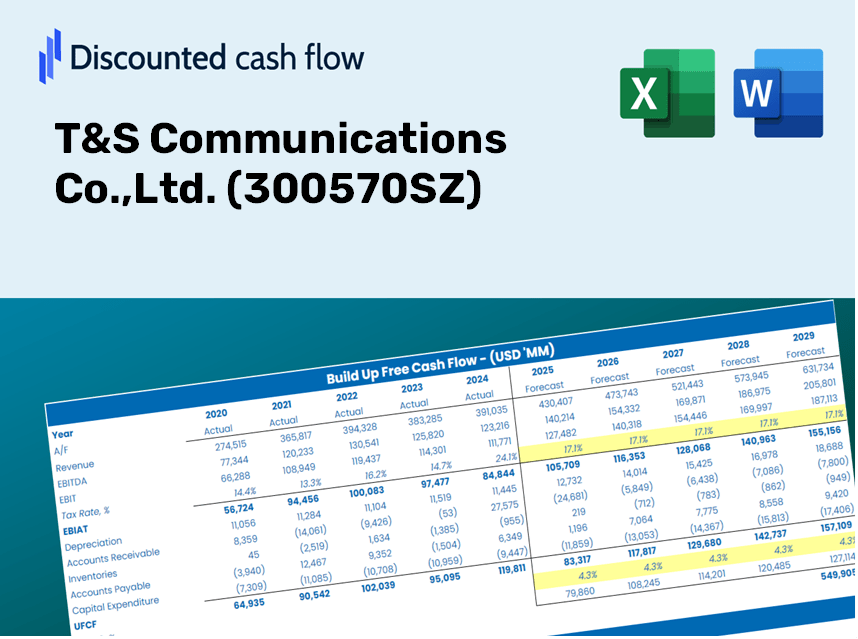
Bewerten Sie die finanziellen Aussichten von T & S Communications Co., Ltd. wie ein Experte! Dieser DCF-Taschenrechner (300570SZ) bietet vorgefüllte Finanzdaten und die Flexibilität, das Umsatzwachstum, WACC, Margen und andere wesentliche Annahmen zu ändern, um sich mit Ihren Vorhersagen auszurichten.
Discounted Cash Flow (DCF) - (USD MM)
| Year | AY1 2020 |
AY2 2021 |
AY3 2022 |
AY4 2023 |
AY5 2024 |
FY1 2025 |
FY2 2026 |
FY3 2027 |
FY4 2028 |
FY5 2029 |
|---|---|---|---|---|---|---|---|---|---|---|
| Revenue | 573.6 | 646.3 | 933.5 | 884.8 | 1,377.8 | 1,748.5 | 2,218.9 | 2,815.8 | 3,573.3 | 4,534.6 |
| Revenue Growth, % | 0 | 12.67 | 44.43 | -5.22 | 55.73 | 26.9 | 26.9 | 26.9 | 26.9 | 26.9 |
| EBITDA | 112.3 | 110.5 | 236.8 | 201.1 | 336.8 | 381.9 | 484.7 | 615.1 | 780.5 | 990.5 |
| EBITDA, % | 19.58 | 17.1 | 25.37 | 22.73 | 24.45 | 21.84 | 21.84 | 21.84 | 21.84 | 21.84 |
| Depreciation | 28.5 | 33.4 | 36.3 | 36.8 | 33.2 | 72.0 | 91.4 | 116.0 | 147.2 | 186.8 |
| Depreciation, % | 4.97 | 5.17 | 3.89 | 4.16 | 2.41 | 4.12 | 4.12 | 4.12 | 4.12 | 4.12 |
| EBIT | 83.8 | 77.1 | 200.5 | 164.3 | 303.6 | 309.9 | 393.3 | 499.1 | 633.3 | 803.7 |
| EBIT, % | 14.6 | 11.93 | 21.48 | 18.57 | 22.04 | 17.72 | 17.72 | 17.72 | 17.72 | 17.72 |
| Total Cash | 596.4 | 631.8 | 458.4 | 604.0 | 727.7 | 1,286.7 | 1,632.8 | 2,072.1 | 2,629.5 | 3,336.9 |
| Total Cash, percent | .0 | .0 | .0 | .0 | .0 | .0 | .0 | .0 | .0 | .0 |
| Account Receivables | 159.4 | 199.9 | 281.1 | 417.9 | 503.7 | 603.6 | 766.0 | 972.1 | 1,233.6 | 1,565.5 |
| Account Receivables, % | 27.78 | 30.93 | 30.11 | 47.23 | 36.56 | 34.52 | 34.52 | 34.52 | 34.52 | 34.52 |
| Inventories | 155.9 | 163.5 | 219.4 | 204.9 | 307.3 | 424.7 | 538.9 | 683.9 | 867.9 | 1,101.4 |
| Inventories, % | 27.18 | 25.3 | 23.5 | 23.15 | 22.31 | 24.29 | 24.29 | 24.29 | 24.29 | 24.29 |
| Accounts Payable | 89.0 | 99.0 | 136.8 | 197.5 | 250.6 | 300.8 | 381.7 | 484.4 | 614.7 | 780.0 |
| Accounts Payable, % | 15.52 | 15.32 | 14.66 | 22.32 | 18.19 | 17.2 | 17.2 | 17.2 | 17.2 | 17.2 |
| Capital Expenditure | -30.7 | -24.1 | -24.5 | -10.1 | -56.3 | -59.2 | -75.1 | -95.4 | -121.0 | -153.6 |
| Capital Expenditure, % | -5.35 | -3.73 | -2.63 | -1.15 | -4.08 | -3.39 | -3.39 | -3.39 | -3.39 | -3.39 |
| Tax Rate, % | 13.93 | 13.93 | 13.93 | 13.93 | 13.93 | 13.93 | 13.93 | 13.93 | 13.93 | 13.93 |
| EBITAT | 75.9 | 71.1 | 179.0 | 155.3 | 261.3 | 280.6 | 356.1 | 451.8 | 573.4 | 727.7 |
| Depreciation | ||||||||||
| Changes in Account Receivables | ||||||||||
| Changes in Inventories | ||||||||||
| Changes in Accounts Payable | ||||||||||
| Capital Expenditure | ||||||||||
| UFCF | -152.5 | 42.3 | 91.6 | 120.3 | 103.1 | 126.3 | 176.6 | 224.1 | 284.4 | 360.9 |
| WACC, % | 7.39 | 7.39 | 7.39 | 7.39 | 7.39 | 7.39 | 7.39 | 7.39 | 7.39 | 7.39 |
| PV UFCF | ||||||||||
| SUM PV UFCF | 918.2 | |||||||||
| Long Term Growth Rate, % | 4.00 | |||||||||
| Free cash flow (T + 1) | 375 | |||||||||
| Terminal Value | 11,087 | |||||||||
| Present Terminal Value | 7,764 | |||||||||
| Enterprise Value | 8,682 | |||||||||
| Net Debt | -471 | |||||||||
| Equity Value | 9,153 | |||||||||
| Diluted Shares Outstanding, MM | 227 | |||||||||
| Equity Value Per Share | 40.29 |
What You Will Receive
- Authentic T&S Communications Data: Preloaded financial metrics – including revenue and EBIT – based on both historical and forecasted figures.
- Comprehensive Customization: Modify all key parameters (yellow cells) such as WACC, growth rates, and tax percentages.
- Real-Time Valuation Updates: Automated recalculations to assess the effects of adjustments on T&S Communications' fair value.
- Flexible Excel Template: Designed for easy modifications, scenario analysis, and in-depth forecasts.
- Efficient and Precise: Avoid the hassle of constructing models from the ground up while ensuring accuracy and adaptability.
Key Features
- Comprehensive Data: T&S Communications Co., Ltd.'s financial statements and comprehensive forecasts are readily available.
- Customizable Parameters: Adjust inputs such as WACC, tax rates, revenue growth, and EBITDA margins to suit your analysis.
- Real-Time Calculations: Instantly view the intrinsic value of T&S Communications (300570SZ) as it updates live.
- Intuitive Visualizations: Dashboard charts effectively illustrate valuation results and essential metrics.
- Designed for Precision: A reliable tool tailored for analysts, investors, and finance professionals.
How It Works
- Step 1: Download the prebuilt Excel template that includes T&S Communications Co.,Ltd.'s (300570SZ) data.
- Step 2: Review the pre-filled sheets to familiarize yourself with the essential metrics.
- Step 3: Modify forecasts and assumptions in the editable yellow cells (WACC, growth, margins).
- Step 4: Instantly see the recalculated outcomes, including the intrinsic value of T&S Communications Co.,Ltd. (300570SZ).
- Step 5: Use the results to make informed investment decisions or create reports.
Why Opt for T&S Communications Co., Ltd. Calculator?
- Designed for Experts: A sophisticated tool tailored for analysts, executives, and industry consultants.
- Accurate Data: Preloaded historical and projected financial data for T&S Communications (300570SZ) to ensure precision.
- Flexible Scenario Analysis: Effortlessly test various forecasts and assumptions.
- Transparent Results: Instantly computes intrinsic value, NPV, and essential financial metrics.
- User-Friendly: Comprehensive step-by-step guidance throughout the entire process.
Who Should Utilize T&S Communications Co., Ltd. ([300570SZ])?
- Investors: Assess the true value of T&S Communications before making investment choices.
- CFOs: Utilize a top-tier DCF model for precise financial reporting and analysis.
- Consultants: Effortlessly customize the template for client valuation reports.
- Entrepreneurs: Discover financial modeling techniques adopted by leading telecom companies.
- Educators: Employ it as a resource to illustrate valuation methods in the classroom.
Contents of the Template
- Pre-Filled Data: Contains T&S Communications Co., Ltd.'s historical financials and projections.
- Discounted Cash Flow Model: Editable DCF valuation model featuring automatic computations.
- Weighted Average Cost of Capital (WACC): A specialized sheet for calculating WACC using personalized inputs.
- Key Financial Ratios: Assess T&S Communications' profitability, efficiency, and financial leverage.
- Customizable Inputs: Easily modify revenue growth, margins, and tax rates.
- Clear Dashboard: Visual representations and tables summarizing essential valuation outcomes.
Disclaimer
All information, articles, and product details provided on this website are for general informational and educational purposes only. We do not claim any ownership over, nor do we intend to infringe upon, any trademarks, copyrights, logos, brand names, or other intellectual property mentioned or depicted on this site. Such intellectual property remains the property of its respective owners, and any references here are made solely for identification or informational purposes, without implying any affiliation, endorsement, or partnership.
We make no representations or warranties, express or implied, regarding the accuracy, completeness, or suitability of any content or products presented. Nothing on this website should be construed as legal, tax, investment, financial, medical, or other professional advice. In addition, no part of this site—including articles or product references—constitutes a solicitation, recommendation, endorsement, advertisement, or offer to buy or sell any securities, franchises, or other financial instruments, particularly in jurisdictions where such activity would be unlawful.
All content is of a general nature and may not address the specific circumstances of any individual or entity. It is not a substitute for professional advice or services. Any actions you take based on the information provided here are strictly at your own risk. You accept full responsibility for any decisions or outcomes arising from your use of this website and agree to release us from any liability in connection with your use of, or reliance upon, the content or products found herein.