
|
Rianlon Corporation (300596.SZ) DCF -Bewertung |
Fully Editable: Tailor To Your Needs In Excel Or Sheets
Professional Design: Trusted, Industry-Standard Templates
Investor-Approved Valuation Models
MAC/PC Compatible, Fully Unlocked
No Expertise Is Needed; Easy To Follow
Rianlon Corporation (300596.SZ) Bundle
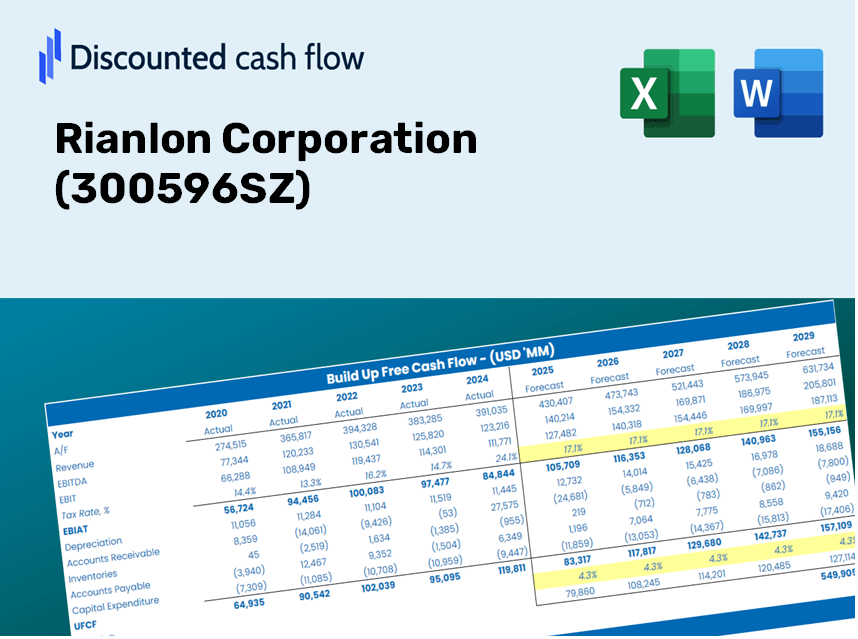
Gewinnen Sie mit unserem ausgeklügelten DCF -Taschenrechner Einblicke in Ihre Rianlon Corporation (300596SZ) -Schanganalyse! Diese Excel -Vorlage mit authentischen (300596SZ) -Daten (300596SZ), ermöglicht es Ihnen, Prognosen und Annahmen anzupassen, um die inneren Wert der Rianlon Corporation genau zu bestimmen.
Discounted Cash Flow (DCF) - (USD MM)
| Year | AY1 2020 |
AY2 2021 |
AY3 2022 |
AY4 2023 |
AY5 2024 |
FY1 2025 |
FY2 2026 |
FY3 2027 |
FY4 2028 |
FY5 2029 |
|---|---|---|---|---|---|---|---|---|---|---|
| Revenue | 2,482.8 | 3,444.6 | 4,842.8 | 5,242.6 | 5,686.9 | 7,052.6 | 8,746.3 | 10,846.8 | 13,451.7 | 16,682.1 |
| Revenue Growth, % | 0 | 38.74 | 40.59 | 8.26 | 8.48 | 24.02 | 24.02 | 24.02 | 24.02 | 24.02 |
| EBITDA | 471.4 | 640.7 | 860.9 | 759.9 | 898.0 | 1,208.1 | 1,498.2 | 1,858.0 | 2,304.2 | 2,857.6 |
| EBITDA, % | 18.99 | 18.6 | 17.78 | 14.5 | 15.79 | 17.13 | 17.13 | 17.13 | 17.13 | 17.13 |
| Depreciation | 110.1 | 134.8 | 231.6 | 289.4 | 360.0 | 352.4 | 437.0 | 541.9 | 672.1 | 833.4 |
| Depreciation, % | 4.44 | 3.91 | 4.78 | 5.52 | 6.33 | 5 | 5 | 5 | 5 | 5 |
| EBIT | 361.2 | 505.9 | 629.3 | 470.5 | 538.1 | 855.7 | 1,061.3 | 1,316.1 | 1,632.2 | 2,024.2 |
| EBIT, % | 14.55 | 14.69 | 12.99 | 8.97 | 9.46 | 12.13 | 12.13 | 12.13 | 12.13 | 12.13 |
| Total Cash | 199.5 | 467.9 | 859.4 | 1,040.0 | 1,230.3 | 1,140.2 | 1,414.0 | 1,753.6 | 2,174.8 | 2,697.0 |
| Total Cash, percent | .0 | .0 | .0 | .0 | .0 | .0 | .0 | .0 | .0 | .0 |
| Account Receivables | 798.2 | 946.4 | 1,141.1 | 1,465.2 | 1,649.9 | 1,976.8 | 2,451.5 | 3,040.3 | 3,770.4 | 4,675.8 |
| Account Receivables, % | 32.15 | 27.47 | 23.56 | 27.95 | 29.01 | 28.03 | 28.03 | 28.03 | 28.03 | 28.03 |
| Inventories | 545.7 | 893.1 | 1,282.3 | 1,142.3 | 1,329.7 | 1,686.3 | 2,091.3 | 2,593.6 | 3,216.4 | 3,988.8 |
| Inventories, % | 21.98 | 25.93 | 26.48 | 21.79 | 23.38 | 23.91 | 23.91 | 23.91 | 23.91 | 23.91 |
| Accounts Payable | 37.0 | 696.5 | 1,103.4 | 516.6 | 901.6 | 990.2 | 1,228.0 | 1,522.9 | 1,888.6 | 2,342.2 |
| Accounts Payable, % | 1.49 | 20.22 | 22.78 | 9.85 | 15.85 | 14.04 | 14.04 | 14.04 | 14.04 | 14.04 |
| Capital Expenditure | -333.2 | -515.0 | -292.8 | -573.7 | -254.7 | -703.0 | -871.8 | -1,081.2 | -1,340.8 | -1,662.8 |
| Capital Expenditure, % | -13.42 | -14.95 | -6.05 | -10.94 | -4.48 | -9.97 | -9.97 | -9.97 | -9.97 | -9.97 |
| Tax Rate, % | 9.42 | 9.42 | 9.42 | 9.42 | 9.42 | 9.42 | 9.42 | 9.42 | 9.42 | 9.42 |
| EBITAT | 315.0 | 443.5 | 568.6 | 417.9 | 487.3 | 760.9 | 943.7 | 1,170.3 | 1,451.4 | 1,799.9 |
| Depreciation | ||||||||||
| Changes in Account Receivables | ||||||||||
| Changes in Inventories | ||||||||||
| Changes in Accounts Payable | ||||||||||
| Capital Expenditure | ||||||||||
| UFCF | -1,214.9 | 227.2 | 330.2 | -637.2 | 605.6 | -184.6 | -133.1 | -165.0 | -204.6 | -253.8 |
| WACC, % | 5.32 | 5.32 | 5.35 | 5.33 | 5.35 | 5.33 | 5.33 | 5.33 | 5.33 | 5.33 |
| PV UFCF | ||||||||||
| SUM PV UFCF | -798.3 | |||||||||
| Long Term Growth Rate, % | 2.00 | |||||||||
| Free cash flow (T + 1) | -259 | |||||||||
| Terminal Value | -7,763 | |||||||||
| Present Terminal Value | -5,987 | |||||||||
| Enterprise Value | -6,785 | |||||||||
| Net Debt | 1,270 | |||||||||
| Equity Value | -8,055 | |||||||||
| Diluted Shares Outstanding, MM | 230 | |||||||||
| Equity Value Per Share | -35.08 |
What You Will Receive
- Accurate Rianlon Financials (300596SZ): Access to historical and projected data for precise valuation.
- Customizable Inputs: Adjust WACC, tax rates, revenue growth, and capital expenditure parameters.
- Real-Time Calculations: Dynamic calculation of intrinsic value and NPV.
- Scenario Analysis: Explore various scenarios to assess Rianlon's future performance.
- User-Friendly Interface: Designed for professionals while remaining approachable for newcomers.
Key Features
- Customizable Forecast Inputs: Adjust essential parameters such as revenue growth rate, EBITDA percentage, and capital expenditures.
- Instant DCF Valuation: Quickly calculates intrinsic value, net present value (NPV), and other important metrics.
- High-Precision Accuracy: Leverages Rianlon Corporation's (300596SZ) real-world financial data for dependable valuation results.
- Effortless Scenario Analysis: Easily evaluate various assumptions and compare the resulting outcomes.
- Efficiency-Enhancing Tool: Removes the necessity of creating intricate valuation models from the ground up.
How It Operates
- Download the Template: Gain immediate access to the Excel-based Rianlon Corporation (300596SZ) DCF Calculator.
- Input Your Assumptions: Modify the yellow-highlighted cells for growth rates, WACC, margins, and other variables.
- Instant Calculations: The model will automatically refresh Rianlon’s intrinsic value.
- Test Scenarios: Experiment with various assumptions to assess possible changes in valuation.
- Analyze and Decide: Leverage the results to inform your investment or financial strategy.
Why Choose This Calculator for Rianlon Corporation (300596SZ)?
- User-Friendly Interface: Perfectly crafted for both novice users and seasoned professionals.
- Customizable Inputs: Easily adjust parameters to tailor your financial analysis.
- Real-Time Feedback: Instantly observe the impact on Rianlon Corporation's valuation as you modify your inputs.
- Preloaded Financial Data: Comes equipped with Rianlon's actual financial figures for swift evaluation.
- Relied Upon by Experts: A trusted tool among investors and analysts for making well-informed decisions.
Who Can Benefit from Rianlon Corporation (300596SZ)?
- Investors: Make informed choices with a top-tier valuation tool tailored for excellence.
- Financial Analysts: Streamline your workflow with a customizable, pre-built DCF model.
- Consultants: Effortlessly modify the template for impactful client presentations and reports.
- Finance Enthusiasts: Enhance your grasp of valuation methods through practical, real-world examples.
- Educators and Students: Leverage this tool as a hands-on resource in finance-related studies.
Contents of the Template
- Pre-Filled Data: Contains Rianlon Corporation’s historical financial information and projections.
- Discounted Cash Flow Model: An editable DCF valuation model featuring automatic calculations.
- Weighted Average Cost of Capital (WACC): A dedicated sheet for WACC calculation using customized inputs.
- Key Financial Ratios: Evaluate Rianlon Corporation's profitability, efficiency, and leverage metrics.
- Customizable Inputs: Easily modify revenue growth, margins, and tax rates.
- Clear Dashboard: Visual representations including charts and tables that summarize key valuation outcomes.
Disclaimer
All information, articles, and product details provided on this website are for general informational and educational purposes only. We do not claim any ownership over, nor do we intend to infringe upon, any trademarks, copyrights, logos, brand names, or other intellectual property mentioned or depicted on this site. Such intellectual property remains the property of its respective owners, and any references here are made solely for identification or informational purposes, without implying any affiliation, endorsement, or partnership.
We make no representations or warranties, express or implied, regarding the accuracy, completeness, or suitability of any content or products presented. Nothing on this website should be construed as legal, tax, investment, financial, medical, or other professional advice. In addition, no part of this site—including articles or product references—constitutes a solicitation, recommendation, endorsement, advertisement, or offer to buy or sell any securities, franchises, or other financial instruments, particularly in jurisdictions where such activity would be unlawful.
All content is of a general nature and may not address the specific circumstances of any individual or entity. It is not a substitute for professional advice or services. Any actions you take based on the information provided here are strictly at your own risk. You accept full responsibility for any decisions or outcomes arising from your use of this website and agree to release us from any liability in connection with your use of, or reliance upon, the content or products found herein.