
|
Wondershare Technology Group Co., Ltd. (300624.Sz) DCF -Bewertung |
Fully Editable: Tailor To Your Needs In Excel Or Sheets
Professional Design: Trusted, Industry-Standard Templates
Investor-Approved Valuation Models
MAC/PC Compatible, Fully Unlocked
No Expertise Is Needed; Easy To Follow
Wondershare Technology Group Co., Ltd. (300624.SZ) Bundle
Entdecken Sie das finanzielle Potenzial der Wondershare Technology Group Co., Ltd. (300624SZ) mit unserem benutzerfreundlichen DCF-Taschenrechner! Geben Sie Ihre Prognosen für Wachstum, Margen und Ausgaben ein, um den inneren Wert der Wondershare Technology Group Co., Ltd. (300624SZ) aufzudecken, und informieren Sie Ihre Anlageentscheidungen.
Discounted Cash Flow (DCF) - (USD MM)
| Year | AY1 2020 |
AY2 2021 |
AY3 2022 |
AY4 2023 |
AY5 2024 |
FY1 2025 |
FY2 2026 |
FY3 2027 |
FY4 2028 |
FY5 2029 |
|---|---|---|---|---|---|---|---|---|---|---|
| Revenue | 976.5 | 1,029.2 | 1,180.1 | 1,480.9 | 1,439.7 | 1,593.7 | 1,764.1 | 1,952.7 | 2,161.6 | 2,392.7 |
| Revenue Growth, % | 0 | 5.39 | 14.67 | 25.49 | -2.78 | 10.69 | 10.69 | 10.69 | 10.69 | 10.69 |
| EBITDA | 136.7 | 46.5 | 92.3 | 144.5 | -80.7 | 97.2 | 107.6 | 119.1 | 131.8 | 145.9 |
| EBITDA, % | 14 | 4.52 | 7.82 | 9.76 | -5.61 | 6.1 | 6.1 | 6.1 | 6.1 | 6.1 |
| Depreciation | 12.9 | 16.6 | 21.4 | 31.5 | 32.8 | 29.2 | 32.3 | 35.8 | 39.6 | 43.8 |
| Depreciation, % | 1.32 | 1.62 | 1.82 | 2.13 | 2.28 | 1.83 | 1.83 | 1.83 | 1.83 | 1.83 |
| EBIT | 123.8 | 29.9 | 70.8 | 113.0 | -113.5 | 68.0 | 75.2 | 83.3 | 92.2 | 102.0 |
| EBIT, % | 12.67 | 2.9 | 6 | 7.63 | -7.88 | 4.26 | 4.26 | 4.26 | 4.26 | 4.26 |
| Total Cash | 489.8 | 661.4 | 558.1 | 695.0 | 531.7 | 782.8 | 866.5 | 959.1 | 1,061.7 | 1,175.2 |
| Total Cash, percent | .0 | .0 | .0 | .0 | .0 | .0 | .0 | .0 | .0 | .0 |
| Account Receivables | 38.2 | 46.2 | 53.6 | 65.4 | 70.2 | 70.8 | 78.4 | 86.8 | 96.1 | 106.4 |
| Account Receivables, % | 3.91 | 4.49 | 4.54 | 4.42 | 4.87 | 4.44 | 4.44 | 4.44 | 4.44 | 4.44 |
| Inventories | .4 | 9.2 | -1.4 | .0 | .0 | 2.6 | 2.9 | 3.2 | 3.5 | 3.9 |
| Inventories, % | 0.03655998 | 0.89332 | -0.11879 | 0 | 0 | 0.16222 | 0.16222 | 0.16222 | 0.16222 | 0.16222 |
| Accounts Payable | 2.6 | 4.6 | 7.6 | 11.8 | 14.1 | 10.0 | 11.1 | 12.2 | 13.5 | 15.0 |
| Accounts Payable, % | 0.26502 | 0.45108 | 0.64142 | 0.79418 | 0.98144 | 0.62663 | 0.62663 | 0.62663 | 0.62663 | 0.62663 |
| Capital Expenditure | -119.4 | -117.2 | -81.5 | -45.7 | -180.7 | -147.1 | -162.8 | -180.3 | -199.5 | -220.9 |
| Capital Expenditure, % | -12.23 | -11.38 | -6.91 | -3.08 | -12.55 | -9.23 | -9.23 | -9.23 | -9.23 | -9.23 |
| Tax Rate, % | -6.02 | -6.02 | -6.02 | -6.02 | -6.02 | -6.02 | -6.02 | -6.02 | -6.02 | -6.02 |
| EBITAT | 110.7 | 17.4 | 39.9 | 91.6 | -120.3 | 52.3 | 57.9 | 64.1 | 71.0 | 78.6 |
| Depreciation | ||||||||||
| Changes in Account Receivables | ||||||||||
| Changes in Inventories | ||||||||||
| Changes in Accounts Payable | ||||||||||
| Capital Expenditure | ||||||||||
| UFCF | -31.7 | -97.9 | -14.1 | 68.4 | -270.7 | -73.0 | -79.4 | -87.9 | -97.2 | -107.6 |
| WACC, % | 5.92 | 5.91 | 5.91 | 5.92 | 5.92 | 5.92 | 5.92 | 5.92 | 5.92 | 5.92 |
| PV UFCF | ||||||||||
| SUM PV UFCF | -371.6 | |||||||||
| Long Term Growth Rate, % | 4.00 | |||||||||
| Free cash flow (T + 1) | -112 | |||||||||
| Terminal Value | -5,835 | |||||||||
| Present Terminal Value | -4,377 | |||||||||
| Enterprise Value | -4,749 | |||||||||
| Net Debt | -380 | |||||||||
| Equity Value | -4,369 | |||||||||
| Diluted Shares Outstanding, MM | 192 | |||||||||
| Equity Value Per Share | -22.72 |
What You Will Receive
- Authentic WOND Financial Data: Pre-filled with Wondershare's historical and projected data for in-depth analysis.
- Completely Customizable Template: Easily adjust key parameters such as revenue growth, WACC, and EBITDA percentage.
- Instant Calculations: Watch Wondershare’s intrinsic value refresh immediately as you make changes.
- Professional Valuation Tool: Tailored for investors, analysts, and consultants aiming for precise DCF outcomes.
- Intuitive Design: Simple layout and clear guidelines suitable for users of all experience levels.
Key Features
- 🔍 Real-Life WTG Financials: Pre-filled historical and projected data for Wondershare Technology Group Co., Ltd. (300624SZ).
- ✏️ Fully Customizable Inputs: Modify all essential parameters (yellow cells) such as WACC, growth %, and tax rates.
- 📊 Professional DCF Valuation: Integrated formulas compute Wondershare’s intrinsic value using the Discounted Cash Flow method.
- ⚡ Instant Results: Visualize Wondershare’s valuation immediately after making adjustments.
- Scenario Analysis: Evaluate and compare results for different financial assumptions side-by-side.
How It Works
- Step 1: Download the Excel file.
- Step 2: Examine the pre-filled Wondershare data (historical and projected).
- Step 3: Modify key assumptions (yellow cells) based on your insights.
- Step 4: Observe automatic recalculations for Wondershare’s intrinsic value.
- Step 5: Utilize the results for investment decisions or reporting.
Why Opt for This Calculator?
- Precision: Authentic financial data from Wondershare Technology Group Co., Ltd. ensures precise calculations.
- Adaptability: Crafted to allow users to easily experiment with and adjust inputs.
- Efficiency: Eliminate the headache of creating a DCF model from the ground up.
- High-Quality: Built with CFO-level accuracy and functionality at its core.
- Intuitive: Simple interface suitable for users with varying levels of financial modeling expertise.
Who Can Benefit from Wondershare Technology Group Co., Ltd. (300624SZ) Solutions?
- Investors: Make informed decisions with a robust suite of tools designed for effective valuation.
- Financial Analysts: Enhance efficiency with customizable, pre-designed financial models at your fingertips.
- Consultants: Seamlessly tailor templates for impactful client presentations or in-depth reports.
- Technology Enthusiasts: Expand your knowledge of financial strategies through practical, real-world applications.
- Educators and Students: Utilize this as a hands-on resource for finance and technology courses.
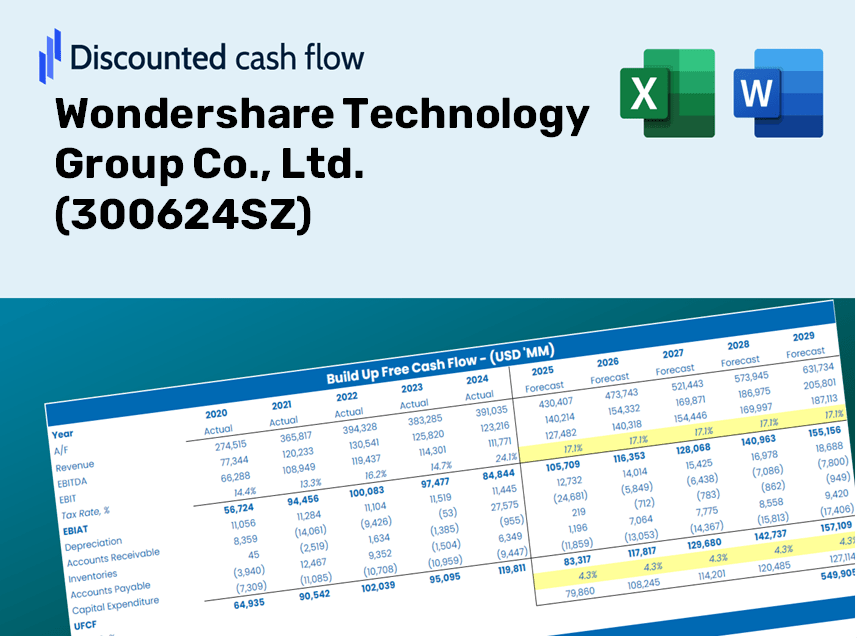
Overview of Template Contents
- Operating and Balance Sheet Data: Pre-filled historical data and projections for Wondershare Technology Group Co., Ltd. (300624SZ), including revenue, EBITDA, EBIT, and capital expenditures.
- WACC Calculation: A dedicated sheet for calculating the Weighted Average Cost of Capital (WACC), featuring parameters such as Beta, risk-free rate, and share price.
- DCF Valuation (Unlevered and Levered): Customizable Discounted Cash Flow models displaying intrinsic value with comprehensive calculations.
- Financial Statements: Pre-loaded annual and quarterly financial statements to facilitate in-depth analysis.
- Key Ratios: Includes critical profitability, leverage, and efficiency ratios pertinent to Wondershare Technology Group Co., Ltd. (300624SZ).
- Dashboard and Charts: Visual representation of valuation outputs and assumptions for straightforward analysis of results.
Disclaimer
All information, articles, and product details provided on this website are for general informational and educational purposes only. We do not claim any ownership over, nor do we intend to infringe upon, any trademarks, copyrights, logos, brand names, or other intellectual property mentioned or depicted on this site. Such intellectual property remains the property of its respective owners, and any references here are made solely for identification or informational purposes, without implying any affiliation, endorsement, or partnership.
We make no representations or warranties, express or implied, regarding the accuracy, completeness, or suitability of any content or products presented. Nothing on this website should be construed as legal, tax, investment, financial, medical, or other professional advice. In addition, no part of this site—including articles or product references—constitutes a solicitation, recommendation, endorsement, advertisement, or offer to buy or sell any securities, franchises, or other financial instruments, particularly in jurisdictions where such activity would be unlawful.
All content is of a general nature and may not address the specific circumstances of any individual or entity. It is not a substitute for professional advice or services. Any actions you take based on the information provided here are strictly at your own risk. You accept full responsibility for any decisions or outcomes arising from your use of this website and agree to release us from any liability in connection with your use of, or reliance upon, the content or products found herein.