
|
Richinfo Technology Co., Ltd. (300634.Sz) DCF -Bewertung |
Fully Editable: Tailor To Your Needs In Excel Or Sheets
Professional Design: Trusted, Industry-Standard Templates
Investor-Approved Valuation Models
MAC/PC Compatible, Fully Unlocked
No Expertise Is Needed; Easy To Follow
Richinfo Technology Co., Ltd. (300634.SZ) Bundle
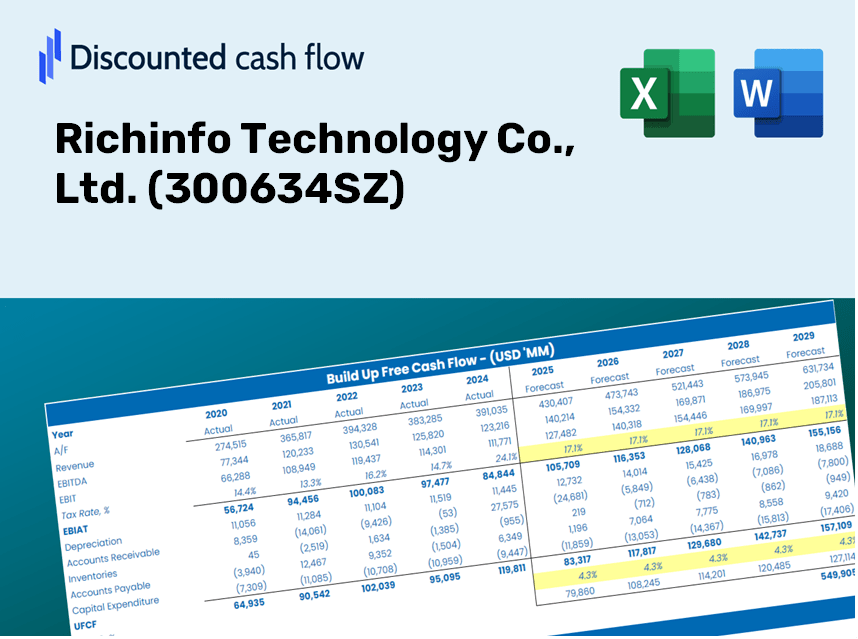
Gewinnen Sie Einblicke in Ihre Richinfo Technology Co., Ltd. (300634SZ) Bewertungsanalyse mit unserem modernsten DCF-Taschenrechner! Diese Excel-Vorlage wird mit Echtzeit-Daten (300634SZ) vorinstalliert, sodass Sie Prognosen und Annahmen für eine genaue Berechnung des intrinsischen Wertes der Richinfo-Technologie anpassen können.
Discounted Cash Flow (DCF) - (USD MM)
| Year | AY1 2020 |
AY2 2021 |
AY3 2022 |
AY4 2023 |
AY5 2024 |
FY1 2025 |
FY2 2026 |
FY3 2027 |
FY4 2028 |
FY5 2029 |
|---|---|---|---|---|---|---|---|---|---|---|
| Revenue | 739.1 | 887.4 | 1,195.4 | 1,496.4 | 1,652.2 | 2,025.4 | 2,482.9 | 3,043.8 | 3,731.4 | 4,574.4 |
| Revenue Growth, % | 0 | 20.06 | 34.71 | 25.18 | 10.41 | 22.59 | 22.59 | 22.59 | 22.59 | 22.59 |
| EBITDA | 147.1 | 163.0 | 198.8 | 219.1 | 228.1 | 337.6 | 413.9 | 507.4 | 622.1 | 762.6 |
| EBITDA, % | 19.9 | 18.37 | 16.63 | 14.64 | 13.81 | 16.67 | 16.67 | 16.67 | 16.67 | 16.67 |
| Depreciation | 28.7 | 29.5 | 22.0 | 37.7 | 28.9 | 53.9 | 66.1 | 81.0 | 99.3 | 121.8 |
| Depreciation, % | 3.88 | 3.33 | 1.84 | 2.52 | 1.75 | 2.66 | 2.66 | 2.66 | 2.66 | 2.66 |
| EBIT | 118.4 | 133.5 | 176.8 | 181.4 | 199.2 | 283.7 | 347.8 | 426.4 | 522.7 | 640.8 |
| EBIT, % | 16.02 | 15.05 | 14.79 | 12.12 | 12.06 | 14.01 | 14.01 | 14.01 | 14.01 | 14.01 |
| Total Cash | 661.2 | 1,117.5 | 1,188.3 | 1,285.7 | 1,419.6 | 1,866.2 | 2,287.8 | 2,804.6 | 3,438.1 | 4,214.8 |
| Total Cash, percent | .0 | .0 | .0 | .0 | .0 | .0 | .0 | .0 | .0 | .0 |
| Account Receivables | 321.2 | 487.9 | 627.2 | 735.9 | 974.9 | 1,049.6 | 1,286.6 | 1,577.3 | 1,933.6 | 2,370.4 |
| Account Receivables, % | 43.46 | 54.99 | 52.46 | 49.18 | 59.01 | 51.82 | 51.82 | 51.82 | 51.82 | 51.82 |
| Inventories | 60.2 | 115.1 | 158.2 | 121.2 | 208.4 | 223.0 | 273.4 | 335.1 | 410.8 | 503.7 |
| Inventories, % | 8.14 | 12.97 | 13.24 | 8.1 | 12.61 | 11.01 | 11.01 | 11.01 | 11.01 | 11.01 |
| Accounts Payable | 64.7 | 75.0 | 132.9 | 199.9 | 228.4 | 224.8 | 275.6 | 337.9 | 414.2 | 507.8 |
| Accounts Payable, % | 8.76 | 8.45 | 11.12 | 13.36 | 13.82 | 11.1 | 11.1 | 11.1 | 11.1 | 11.1 |
| Capital Expenditure | -73.4 | -43.4 | -32.2 | -39.5 | -53.3 | -94.7 | -116.1 | -142.3 | -174.4 | -213.9 |
| Capital Expenditure, % | -9.93 | -4.89 | -2.7 | -2.64 | -3.22 | -4.67 | -4.67 | -4.67 | -4.67 | -4.67 |
| Tax Rate, % | -7.75 | -7.75 | -7.75 | -7.75 | -7.75 | -7.75 | -7.75 | -7.75 | -7.75 | -7.75 |
| EBITAT | 108.5 | 120.2 | 166.7 | 171.2 | 214.7 | 266.8 | 327.1 | 401.0 | 491.6 | 602.6 |
| Depreciation | ||||||||||
| Changes in Account Receivables | ||||||||||
| Changes in Inventories | ||||||||||
| Changes in Accounts Payable | ||||||||||
| Capital Expenditure | ||||||||||
| UFCF | -252.9 | -105.0 | 32.0 | 164.6 | -107.4 | 133.2 | 40.4 | 49.6 | 60.8 | 74.5 |
| WACC, % | 4.53 | 4.53 | 4.53 | 4.53 | 4.53 | 4.53 | 4.53 | 4.53 | 4.53 | 4.53 |
| PV UFCF | ||||||||||
| SUM PV UFCF | 318.4 | |||||||||
| Long Term Growth Rate, % | 4.00 | |||||||||
| Free cash flow (T + 1) | 77 | |||||||||
| Terminal Value | 14,620 | |||||||||
| Present Terminal Value | 11,715 | |||||||||
| Enterprise Value | 12,033 | |||||||||
| Net Debt | -953 | |||||||||
| Equity Value | 12,986 | |||||||||
| Diluted Shares Outstanding, MM | 451 | |||||||||
| Equity Value Per Share | 28.78 |
What You Will Gain
- Accurate Richinfo Data: Access to comprehensive financials – including revenue and EBIT – derived from actual and forecasted metrics.
- Complete Customization: Modify all essential parameters (yellow cells) such as WACC, growth rates, and tax percentages.
- Real-Time Valuation Updates: Automatic recalibrations to assess the effects of modifications on Richinfo's fair value.
- Flexible Excel Template: Designed for easy adjustments, scenario analysis, and in-depth forecasting.
- Efficient and Precise: Avoid the hassle of building models from scratch while ensuring accuracy and adaptability.
Key Features
- Customizable Forecast Inputs: Adjust essential factors like revenue growth, EBITDA percentage, and capital expenditures.
- Instant DCF Valuation: Automatically computes intrinsic value, NPV, and additional financial metrics.
- High-Precision Accuracy: Leverages Richinfo Technology Co., Ltd.'s real-world financial data for credible valuation results.
- Simplified Scenario Analysis: Effortlessly evaluate various assumptions and analyze the resulting impacts.
- Efficiency Booster: Remove the hassle of constructing intricate valuation models from the ground up.
How It Works
- Step 1: Download the prebuilt Excel template featuring Richinfo Technology Co., Ltd.'s (300634SZ) data.
- Step 2: Review the pre-filled sheets to familiarize yourself with the key metrics.
- Step 3: Adjust forecasts and assumptions in the editable yellow cells (WACC, growth, margins).
- Step 4: Instantly see recalculated results, including Richinfo Technology Co., Ltd.'s (300634SZ) intrinsic value.
- Step 5: Make informed investment decisions or create reports based on the outputs.
Why Choose the Richinfo Calculator?
- Designed for Industry Leaders: A sophisticated tool crafted for analysts, CFOs, and consultants.
- Up-to-Date Data: Richinfo’s historical and projected financials preloaded for precision.
- Scenario Analysis: Effortlessly simulate various forecasts and assumptions.
- Comprehensive Outputs: Instantly calculates intrinsic value, NPV, and essential metrics.
- User-Friendly: Step-by-step guidance makes the process straightforward.
Who Should Utilize This Product?
- Investors: Assess Richinfo Technology Co., Ltd.’s (300634SZ) valuation prior to trading stocks.
- CFOs and Financial Analysts: Enhance valuation processes and evaluate financial projections.
- Startup Founders: Understand the valuation methods of leading public companies like Richinfo Technology Co., Ltd. (300634SZ).
- Consultants: Create comprehensive valuation reports for clients.
- Students and Educators: Utilize real-world data to practice and teach valuation methodologies.
Contents of the Richinfo Technology Template
- Thorough DCF Model: An editable template featuring intricate valuation computations.
- Real-Time Data: Richinfo Technology’s historical and projected financials are preloaded for in-depth analysis.
- Customizable Variables: Modify WACC, growth rates, and tax assumptions to explore various scenarios.
- Comprehensive Financial Statements: Complete annual and quarterly breakdowns for enhanced insights.
- Essential Ratios: Integrated analysis for assessing profitability, efficiency, and leverage.
- Interactive Dashboard with Visual Outputs: Charts and tables for clear, actionable insights.
Disclaimer
All information, articles, and product details provided on this website are for general informational and educational purposes only. We do not claim any ownership over, nor do we intend to infringe upon, any trademarks, copyrights, logos, brand names, or other intellectual property mentioned or depicted on this site. Such intellectual property remains the property of its respective owners, and any references here are made solely for identification or informational purposes, without implying any affiliation, endorsement, or partnership.
We make no representations or warranties, express or implied, regarding the accuracy, completeness, or suitability of any content or products presented. Nothing on this website should be construed as legal, tax, investment, financial, medical, or other professional advice. In addition, no part of this site—including articles or product references—constitutes a solicitation, recommendation, endorsement, advertisement, or offer to buy or sell any securities, franchises, or other financial instruments, particularly in jurisdictions where such activity would be unlawful.
All content is of a general nature and may not address the specific circumstances of any individual or entity. It is not a substitute for professional advice or services. Any actions you take based on the information provided here are strictly at your own risk. You accept full responsibility for any decisions or outcomes arising from your use of this website and agree to release us from any liability in connection with your use of, or reliance upon, the content or products found herein.