
|
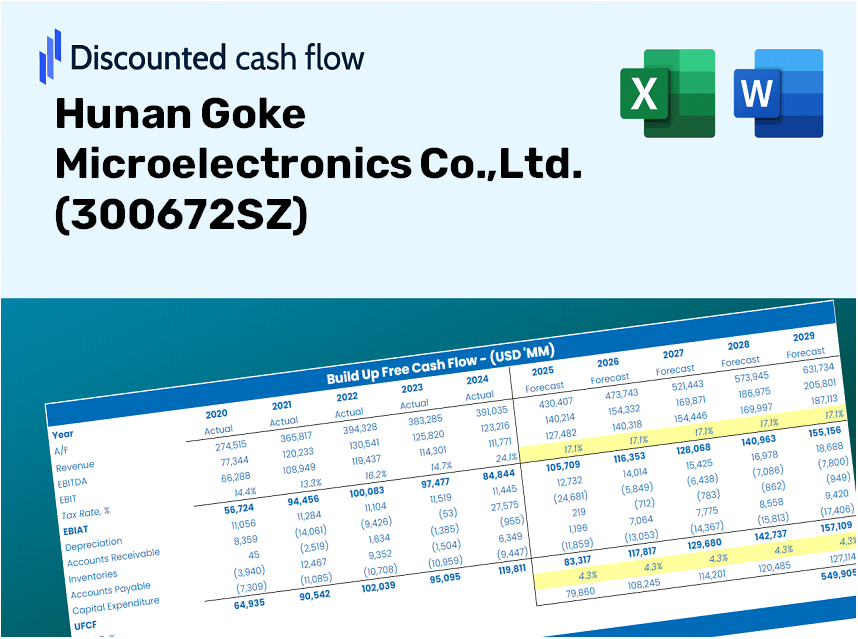
Hunan Goke Microelectronics Co., Ltd. (300672.Sz) DCF -Bewertung |
Fully Editable: Tailor To Your Needs In Excel Or Sheets
Professional Design: Trusted, Industry-Standard Templates
Investor-Approved Valuation Models
MAC/PC Compatible, Fully Unlocked
No Expertise Is Needed; Easy To Follow
Hunan Goke Microelectronics Co.,Ltd. (300672.SZ) Bundle
Entdecken Sie das wahre Potenzial von Hunan Goke Microelectronics Co., Ltd. (300672SZ) mit unserem fortschrittlichen DCF -Taschenrechner! Einfach die wichtigsten Annahmen anpassen, verschiedene Szenarien erkunden und beurteilen, wie sich Änderungen auswirken, wie sich Hunan Goke Microelectronics Co., Ltd. (300672SZ) bewerten - alles innerhalb einer bequemen Excel -Vorlage.
Discounted Cash Flow (DCF) - (USD MM)
| Year | AY1 2020 |
AY2 2021 |
AY3 2022 |
AY4 2023 |
AY5 2024 |
FY1 2025 |
FY2 2026 |
FY3 2027 |
FY4 2028 |
FY5 2029 |
|---|---|---|---|---|---|---|---|---|---|---|
| Revenue | 730.9 | 2,321.9 | 3,604.9 | 4,231.3 | 1,977.9 | 2,568.2 | 3,334.6 | 4,329.8 | 5,622.0 | 7,299.9 |
| Revenue Growth, % | 0 | 217.66 | 55.26 | 17.38 | -53.26 | 29.84 | 29.84 | 29.84 | 29.84 | 29.84 |
| EBITDA | 144.7 | 411.5 | 303.0 | 201.9 | -3.3 | 259.5 | 337.0 | 437.5 | 568.1 | 737.7 |
| EBITDA, % | 19.79 | 17.72 | 8.4 | 4.77 | -0.16528 | 10.1 | 10.1 | 10.1 | 10.1 | 10.1 |
| Depreciation | 60.3 | 119.8 | 183.9 | 205.9 | 44.2 | 131.6 | 170.9 | 221.9 | 288.1 | 374.0 |
| Depreciation, % | 8.25 | 5.16 | 5.1 | 4.87 | 2.24 | 5.12 | 5.12 | 5.12 | 5.12 | 5.12 |
| EBIT | 84.3 | 291.7 | 119.0 | -4.0 | -47.5 | 127.9 | 166.1 | 215.7 | 280.0 | 363.6 |
| EBIT, % | 11.54 | 12.57 | 3.3 | -0.09569533 | -2.4 | 4.98 | 4.98 | 4.98 | 4.98 | 4.98 |
| Total Cash | 523.1 | 344.0 | 1,189.2 | 1,511.3 | 1,555.7 | 1,200.6 | 1,558.9 | 2,024.1 | 2,628.2 | 3,412.6 |
| Total Cash, percent | .0 | .0 | .0 | .0 | .0 | .0 | .0 | .0 | .0 | .0 |
| Account Receivables | 269.6 | 180.8 | 298.1 | 715.8 | 556.4 | 503.3 | 653.5 | 848.5 | 1,101.8 | 1,430.6 |
| Account Receivables, % | 36.89 | 7.79 | 8.27 | 16.92 | 28.13 | 19.6 | 19.6 | 19.6 | 19.6 | 19.6 |
| Inventories | 227.3 | 1,045.4 | 2,399.0 | 1,062.8 | 1,064.8 | 1,138.3 | 1,478.1 | 1,919.2 | 2,491.9 | 3,235.7 |
| Inventories, % | 31.1 | 45.02 | 66.55 | 25.12 | 53.84 | 44.32 | 44.32 | 44.32 | 44.32 | 44.32 |
| Accounts Payable | 136.1 | 225.5 | 173.9 | 913.2 | 338.8 | 369.1 | 479.3 | 622.3 | 808.0 | 1,049.2 |
| Accounts Payable, % | 18.62 | 9.71 | 4.83 | 21.58 | 17.13 | 14.37 | 14.37 | 14.37 | 14.37 | 14.37 |
| Capital Expenditure | -213.3 | -442.4 | -247.9 | -554.1 | -636.4 | -515.6 | -669.5 | -869.3 | -1,128.8 | -1,465.6 |
| Capital Expenditure, % | -29.18 | -19.05 | -6.88 | -13.09 | -32.18 | -20.08 | -20.08 | -20.08 | -20.08 | -20.08 |
| Tax Rate, % | -54.65 | -54.65 | -54.65 | -54.65 | -54.65 | -54.65 | -54.65 | -54.65 | -54.65 | -54.65 |
| EBITAT | 109.3 | 315.3 | 165.0 | -7.7 | -73.5 | 127.9 | 166.1 | 215.7 | 280.0 | 363.6 |
| Depreciation | ||||||||||
| Changes in Account Receivables | ||||||||||
| Changes in Inventories | ||||||||||
| Changes in Accounts Payable | ||||||||||
| Capital Expenditure | ||||||||||
| UFCF | -404.5 | -647.2 | -1,421.4 | 1,302.1 | -1,082.8 | -246.2 | -712.3 | -924.9 | -1,200.9 | -1,559.3 |
| WACC, % | 5.62 | 5.62 | 5.62 | 5.62 | 5.62 | 5.62 | 5.62 | 5.62 | 5.62 | 5.62 |
| PV UFCF | ||||||||||
| SUM PV UFCF | -3,807.8 | |||||||||
| Long Term Growth Rate, % | 4.00 | |||||||||
| Free cash flow (T + 1) | -1,622 | |||||||||
| Terminal Value | -100,054 | |||||||||
| Present Terminal Value | -76,118 | |||||||||
| Enterprise Value | -79,925 | |||||||||
| Net Debt | 1,014 | |||||||||
| Equity Value | -80,939 | |||||||||
| Diluted Shares Outstanding, MM | 216 | |||||||||
| Equity Value Per Share | -373.89 |
What You Will Receive
- Authentic Hunan Goke Financial Data: Access to historical and projected figures for precise valuation.
- Customizable Inputs: Adjust WACC, tax rates, revenue growth, and capital expenditures as needed.
- Automated Calculations: Intrinsic value and NPV calculated in real-time.
- Scenario Analysis: Explore various scenarios to assess Hunan Goke's future performance.
- User-Friendly Design: Crafted for professionals while remaining approachable for newcomers.
Key Features
- Pre-Loaded Data: Historical financial statements and pre-filled forecasts for Hunan Goke Microelectronics Co., Ltd. (300672SZ).
- Fully Adjustable Inputs: Customize WACC, tax rates, revenue growth, and EBITDA margins to suit your analysis.
- Instant Results: Watch the intrinsic value of Hunan Goke Microelectronics Co., Ltd. (300672SZ) update in real time.
- Clear Visual Outputs: Insightful dashboard charts present valuation results and essential metrics.
- Built for Accuracy: A robust tool designed for analysts, investors, and finance professionals.
How It Works
- 1. Access the Template: Download and open the Excel file containing Hunan Goke Microelectronics Co., Ltd.'s (300672SZ) preloaded data.
- 2. Adjust Assumptions: Modify essential inputs such as growth projections, WACC, and capital expenditures.
- 3. Get Instant Results: The DCF model automatically calculates the intrinsic value and NPV based on your changes.
- 4. Explore Different Scenarios: Analyze various forecasts to evaluate different valuation outcomes.
- 5. Present with Assurance: Deliver professional valuation insights to bolster your decision-making process.
Why Opt for Goke's Financial Calculator?
- Precision: Based on accurate data from Hunan Goke Microelectronics Co., Ltd. ensures reliable results.
- Versatility: Built to allow users to effortlessly test and adjust parameters.
- Efficiency: Avoid the complexities of constructing a DCF model from the ground up.
- Expert-Level: Crafted with the professionalism and usability expected at the CFO level.
- Intuitive Interface: Simple to navigate, ensuring accessibility for users with varying levels of financial expertise.
Who Can Benefit from This Product?
- Investors: Evaluate Hunan Goke Microelectronics Co., Ltd.’s (300672SZ) valuation before making trading decisions.
- CFOs and Financial Analysts: Optimize valuation assessments and validate forecasts for Hunan Goke Microelectronics Co., Ltd. (300672SZ).
- Startup Founders: Gain insights into how companies like Hunan Goke Microelectronics Co., Ltd. (300672SZ) establish their market value.
- Consultants: Produce expert valuation analysis and reports for your clients with a focus on Hunan Goke Microelectronics Co., Ltd. (300672SZ).
- Students and Educators: Utilize real data from Hunan Goke Microelectronics Co., Ltd. (300672SZ) to enhance learning and practice valuation methodologies.
Contents of the Template
- Historical Data: Contains past financials and baseline forecasts for Hunan Goke Microelectronics Co., Ltd. (300672SZ).
- DCF and Levered DCF Models: Comprehensive templates designed to estimate the intrinsic value of Hunan Goke Microelectronics Co., Ltd. (300672SZ).
- WACC Sheet: Pre-constructed calculations for the Weighted Average Cost of Capital.
- Editable Inputs: Adjust essential drivers such as growth rates, EBITDA %, and CAPEX assumptions.
- Quarterly and Annual Statements: A thorough overview of the financials of Hunan Goke Microelectronics Co., Ltd. (300672SZ).
- Interactive Dashboard: Visualize valuation outcomes and projections in an engaging manner.
Disclaimer
All information, articles, and product details provided on this website are for general informational and educational purposes only. We do not claim any ownership over, nor do we intend to infringe upon, any trademarks, copyrights, logos, brand names, or other intellectual property mentioned or depicted on this site. Such intellectual property remains the property of its respective owners, and any references here are made solely for identification or informational purposes, without implying any affiliation, endorsement, or partnership.
We make no representations or warranties, express or implied, regarding the accuracy, completeness, or suitability of any content or products presented. Nothing on this website should be construed as legal, tax, investment, financial, medical, or other professional advice. In addition, no part of this site—including articles or product references—constitutes a solicitation, recommendation, endorsement, advertisement, or offer to buy or sell any securities, franchises, or other financial instruments, particularly in jurisdictions where such activity would be unlawful.
All content is of a general nature and may not address the specific circumstances of any individual or entity. It is not a substitute for professional advice or services. Any actions you take based on the information provided here are strictly at your own risk. You accept full responsibility for any decisions or outcomes arising from your use of this website and agree to release us from any liability in connection with your use of, or reliance upon, the content or products found herein.