
|
Chengdu Informationstechnologie der chinesischen Akademie der Sciences Co., Ltd (300678.sz) DCF -Bewertung |
Fully Editable: Tailor To Your Needs In Excel Or Sheets
Professional Design: Trusted, Industry-Standard Templates
Investor-Approved Valuation Models
MAC/PC Compatible, Fully Unlocked
No Expertise Is Needed; Easy To Follow
Chengdu Information Technology of Chinese Academy of Sciences Co.,Ltd (300678.SZ) Bundle
Optimieren Sie Ihre Zeit und verbessern Sie die Präzision mit unserem DCF -Taschenrechner (300678SZ)! Ausgestattet mit echten Daten der Chengdu Informationstechnologie der chinesischen Akademie der Sciences Co., Ltd und anpassbaren Annahmen ermöglicht Ihnen dieses Tool, die Chengdu -Informationstechnologie wie einen erfahrenen Investor prognostizieren, analysieren und bewerten.
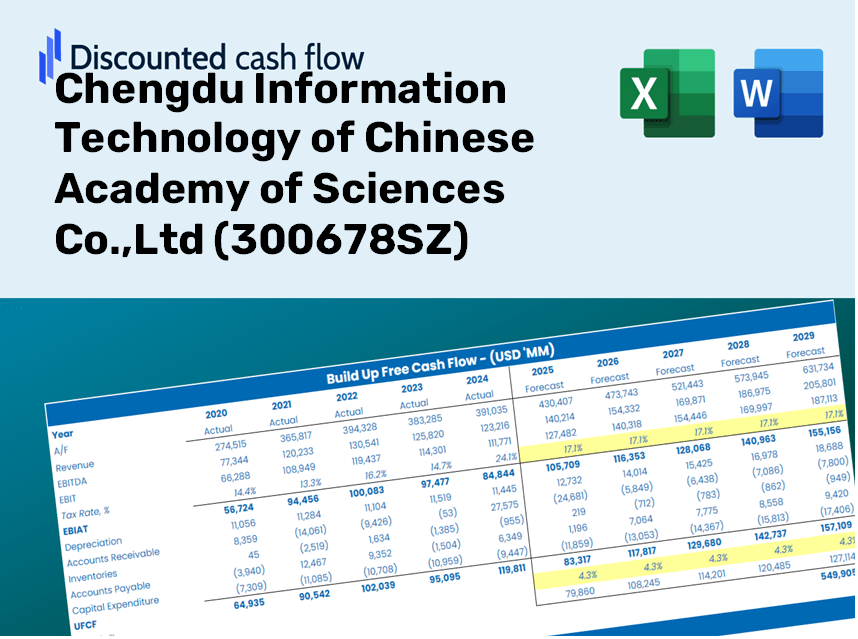
Discounted Cash Flow (DCF) - (USD MM)
| Year | AY1 2020 |
AY2 2021 |
AY3 2022 |
AY4 2023 |
AY5 2024 |
FY1 2025 |
FY2 2026 |
FY3 2027 |
FY4 2028 |
FY5 2029 |
|---|---|---|---|---|---|---|---|---|---|---|
| Revenue | 500.9 | 495.4 | 554.7 | 591.4 | 507.0 | 511.1 | 515.2 | 519.4 | 523.5 | 527.8 |
| Revenue Growth, % | 0 | -1.09 | 11.97 | 6.61 | -14.27 | 0.80556 | 0.80556 | 0.80556 | 0.80556 | 0.80556 |
| EBITDA | 40.6 | 36.9 | 31.5 | 21.4 | -18.8 | 21.6 | 21.8 | 22.0 | 22.2 | 22.3 |
| EBITDA, % | 8.11 | 7.45 | 5.67 | 3.63 | -3.71 | 4.23 | 4.23 | 4.23 | 4.23 | 4.23 |
| Depreciation | 3.4 | 4.0 | 5.4 | 6.9 | 2.2 | 4.1 | 4.2 | 4.2 | 4.2 | 4.3 |
| Depreciation, % | 0.67179 | 0.80258 | 0.98195 | 1.16 | 0.43061 | 0.80923 | 0.80923 | 0.80923 | 0.80923 | 0.80923 |
| EBIT | 37.3 | 32.9 | 26.0 | 14.6 | -21.0 | 17.5 | 17.6 | 17.8 | 17.9 | 18.1 |
| EBIT, % | 7.44 | 6.65 | 4.69 | 2.47 | -4.14 | 3.42 | 3.42 | 3.42 | 3.42 | 3.42 |
| Total Cash | 253.3 | 260.0 | 482.4 | 501.3 | 476.1 | 376.9 | 379.9 | 383.0 | 386.0 | 389.1 |
| Total Cash, percent | .0 | .0 | .0 | .0 | .0 | .0 | .0 | .0 | .0 | .0 |
| Account Receivables | 367.7 | 409.1 | 297.2 | 332.9 | 288.0 | 329.8 | 332.5 | 335.2 | 337.9 | 340.6 |
| Account Receivables, % | 73.42 | 82.59 | 53.57 | 56.29 | 56.81 | 64.53 | 64.53 | 64.53 | 64.53 | 64.53 |
| Inventories | 82.5 | 112.1 | 118.9 | 159.1 | 91.5 | 107.8 | 108.7 | 109.6 | 110.5 | 111.3 |
| Inventories, % | 16.48 | 22.63 | 21.43 | 26.9 | 18.05 | 21.1 | 21.1 | 21.1 | 21.1 | 21.1 |
| Accounts Payable | 118.0 | 156.8 | 150.9 | 186.3 | 168.9 | 150.5 | 151.7 | 152.9 | 154.1 | 155.4 |
| Accounts Payable, % | 23.56 | 31.65 | 27.2 | 31.49 | 33.31 | 29.44 | 29.44 | 29.44 | 29.44 | 29.44 |
| Capital Expenditure | -3.4 | -8.6 | -15.9 | -6.8 | -1.0 | -6.8 | -6.8 | -6.9 | -6.9 | -7.0 |
| Capital Expenditure, % | -0.68325 | -1.73 | -2.86 | -1.15 | -0.20584 | -1.32 | -1.32 | -1.32 | -1.32 | -1.32 |
| Tax Rate, % | -265.68 | -265.68 | -265.68 | -265.68 | -265.68 | -265.68 | -265.68 | -265.68 | -265.68 | -265.68 |
| EBITAT | 33.6 | 30.2 | 24.0 | 13.2 | -76.7 | 16.3 | 16.4 | 16.5 | 16.6 | 16.8 |
| Depreciation | ||||||||||
| Changes in Account Receivables | ||||||||||
| Changes in Inventories | ||||||||||
| Changes in Accounts Payable | ||||||||||
| Capital Expenditure | ||||||||||
| UFCF | -298.7 | -6.6 | 112.9 | -27.3 | 19.5 | -62.9 | 11.4 | 11.5 | 11.6 | 11.7 |
| WACC, % | 4.66 | 4.66 | 4.66 | 4.66 | 4.66 | 4.66 | 4.66 | 4.66 | 4.66 | 4.66 |
| PV UFCF | ||||||||||
| SUM PV UFCF | -20.6 | |||||||||
| Long Term Growth Rate, % | 4.00 | |||||||||
| Free cash flow (T + 1) | 12 | |||||||||
| Terminal Value | 1,838 | |||||||||
| Present Terminal Value | 1,463 | |||||||||
| Enterprise Value | 1,443 | |||||||||
| Net Debt | -460 | |||||||||
| Equity Value | 1,903 | |||||||||
| Diluted Shares Outstanding, MM | 296 | |||||||||
| Equity Value Per Share | 6.42 |
Advantages You Will Enjoy
- Authentic 300678SZ Financial Data: Pre-populated with Chengdu Information Technology's historical and forecasted data for accurate analysis.
- Completely Customizable Template: Easily adjust key inputs such as revenue growth, WACC, and EBITDA percentages.
- Instantaneous Calculations: Watch 300678SZ's intrinsic value refresh in real-time as you make adjustments.
- Expert Valuation Tool: Tailored for investors, analysts, and consultants aiming for reliable DCF outcomes.
- User-Friendly Interface: A straightforward layout and easy-to-follow instructions suitable for users of all skill levels.
Key Features
- Customizable Forecast Variables: Adjust essential inputs such as revenue growth, EBITDA %, and capital expenditures.
- Instant DCF Valuation: Automatically computes intrinsic value, NPV, and other critical metrics in real time.
- High-Precision Accuracy: Leverages Chengdu Information Technology's actual financial data for credible valuation results.
- Simplified Scenario Analysis: Effortlessly evaluate various assumptions and analyze outcomes side by side.
- Efficient Valuation Solution: Remove the hassle of constructing intricate valuation models from the ground up.
How It Functions
- Download the Template: Gain immediate access to the Excel-based Chengdu Information Technology DCF Calculator.
- Input Your Assumptions: Modify the yellow-highlighted cells for growth rates, WACC, profit margins, and additional variables.
- Instant Calculations: The model automatically recalculates the intrinsic value of Chengdu Information Technology (300678SZ).
- Test Scenarios: Run simulations with varying assumptions to assess potential changes in valuation.
- Analyze and Decide: Utilize the outcomes to inform your investment strategies or financial assessments.
Why Opt for This Calculator for Chengdu Information Technology of Chinese Academy of Sciences Co., Ltd (300678SZ)?
- Time Efficient: Skip the hassle of building a DCF model from the ground up – it's fully operational and ready for immediate use.
- Enhanced Precision: Dependable financial data and calculations minimize the risk of errors in your valuation process.
- Completely Customizable: Adjust the model to align with your specific assumptions and forecasts.
- User-Friendly: Intuitive charts and outputs provide straightforward results for easy analysis.
- Preferred by Professionals: Crafted for industry experts who prioritize both accuracy and ease of use.
Who Can Benefit from This Product?
- Finance Students: Master valuation methodologies and practice with real market data.
- Researchers: Utilize advanced models in your academic projects or studies.
- Investors: Evaluate your financial hypotheses and assess valuation projections for Chengdu Information Technology of Chinese Academy of Sciences Co.,Ltd (300678SZ).
- Market Analysts: Enhance your analysis process with a ready-to-use, customizable DCF model.
- Entrepreneurs: Discover how major public entities like Chengdu Information Technology of Chinese Academy of Sciences Co.,Ltd (300678SZ) are assessed in the market.
Contents of the Template
- Operating and Balance Sheet Data: Pre-filled historical data and forecasts for Chengdu Information Technology of Chinese Academy of Sciences Co.,Ltd (300678SZ), including revenue, EBITDA, EBIT, and capital expenditures.
- WACC Calculation: A dedicated sheet for calculating the Weighted Average Cost of Capital (WACC), incorporating parameters such as Beta, risk-free rate, and share price.
- DCF Valuation (Unlevered and Levered): Customizable Discounted Cash Flow models providing intrinsic value along with detailed calculations.
- Financial Statements: Pre-loaded financial statements (annual and quarterly) to facilitate comprehensive analysis.
- Key Ratios: Features profitability, leverage, and efficiency ratios specific to Chengdu Information Technology of Chinese Academy of Sciences Co.,Ltd (300678SZ).
- Dashboard and Charts: Visual representation of valuation outcomes and assumptions for straightforward result analysis.
Disclaimer
All information, articles, and product details provided on this website are for general informational and educational purposes only. We do not claim any ownership over, nor do we intend to infringe upon, any trademarks, copyrights, logos, brand names, or other intellectual property mentioned or depicted on this site. Such intellectual property remains the property of its respective owners, and any references here are made solely for identification or informational purposes, without implying any affiliation, endorsement, or partnership.
We make no representations or warranties, express or implied, regarding the accuracy, completeness, or suitability of any content or products presented. Nothing on this website should be construed as legal, tax, investment, financial, medical, or other professional advice. In addition, no part of this site—including articles or product references—constitutes a solicitation, recommendation, endorsement, advertisement, or offer to buy or sell any securities, franchises, or other financial instruments, particularly in jurisdictions where such activity would be unlawful.
All content is of a general nature and may not address the specific circumstances of any individual or entity. It is not a substitute for professional advice or services. Any actions you take based on the information provided here are strictly at your own risk. You accept full responsibility for any decisions or outcomes arising from your use of this website and agree to release us from any liability in connection with your use of, or reliance upon, the content or products found herein.