
|
Electric Connector Technology Co., Ltd. (300679.sz) DCF -Bewertung |
Fully Editable: Tailor To Your Needs In Excel Or Sheets
Professional Design: Trusted, Industry-Standard Templates
Investor-Approved Valuation Models
MAC/PC Compatible, Fully Unlocked
No Expertise Is Needed; Easy To Follow
Electric Connector Technology Co., Ltd. (300679.SZ) Bundle
Optimieren Sie Ihre Zeit und verbessern Sie die Präzision mit unserem DCF -Taschenrechner (300679SZ)! Mit realen Daten von Electric Connector Technology Co., Ltd. und anpassbaren Annahmen ermöglichen dieses Tool Sie, wie ein erfahrener Investor prognostiziert, analysieren und bewerten (300679SZ).
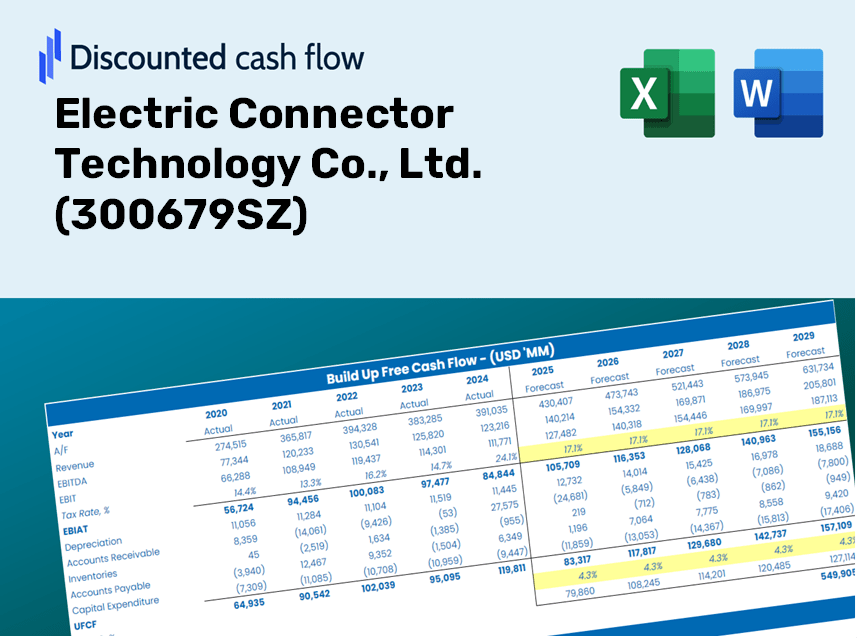
Discounted Cash Flow (DCF) - (USD MM)
| Year | AY1 2020 |
AY2 2021 |
AY3 2022 |
AY4 2023 |
AY5 2024 |
FY1 2025 |
FY2 2026 |
FY3 2027 |
FY4 2028 |
FY5 2029 |
|---|---|---|---|---|---|---|---|---|---|---|
| Revenue | 2,592.5 | 3,245.7 | 2,969.6 | 3,129.1 | 4,661.2 | 5,488.9 | 6,463.5 | 7,611.2 | 8,962.7 | 10,554.1 |
| Revenue Growth, % | 0 | 25.2 | -8.51 | 5.37 | 48.97 | 17.76 | 17.76 | 17.76 | 17.76 | 17.76 |
| EBITDA | 338.7 | 512.1 | 393.8 | 450.4 | 775.2 | 802.8 | 945.3 | 1,113.2 | 1,310.9 | 1,543.6 |
| EBITDA, % | 13.07 | 15.78 | 13.26 | 14.39 | 16.63 | 14.63 | 14.63 | 14.63 | 14.63 | 14.63 |
| Depreciation | 91.1 | 113.9 | 121.0 | 137.8 | 158.4 | 207.5 | 244.3 | 287.7 | 338.8 | 398.9 |
| Depreciation, % | 3.51 | 3.51 | 4.07 | 4.4 | 3.4 | 3.78 | 3.78 | 3.78 | 3.78 | 3.78 |
| EBIT | 247.6 | 398.2 | 272.8 | 312.6 | 616.8 | 595.3 | 701.0 | 825.5 | 972.1 | 1,144.7 |
| EBIT, % | 9.55 | 12.27 | 9.19 | 9.99 | 13.23 | 10.85 | 10.85 | 10.85 | 10.85 | 10.85 |
| Total Cash | 2,257.1 | 2,079.7 | 1,842.3 | 1,571.6 | 1,187.4 | 3,171.2 | 3,734.3 | 4,397.4 | 5,178.2 | 6,097.7 |
| Total Cash, percent | .0 | .0 | .0 | .0 | .0 | .0 | .0 | .0 | .0 | .0 |
| Account Receivables | 875.6 | 963.7 | 951.7 | 1,297.7 | 2,123.9 | 2,004.0 | 2,359.9 | 2,778.9 | 3,272.3 | 3,853.4 |
| Account Receivables, % | 33.78 | 29.69 | 32.05 | 41.47 | 45.56 | 36.51 | 36.51 | 36.51 | 36.51 | 36.51 |
| Inventories | 489.6 | 533.4 | 489.3 | 570.5 | 762.9 | 948.4 | 1,116.8 | 1,315.1 | 1,548.6 | 1,823.6 |
| Inventories, % | 18.89 | 16.43 | 16.48 | 18.23 | 16.37 | 17.28 | 17.28 | 17.28 | 17.28 | 17.28 |
| Accounts Payable | 822.8 | 757.7 | 778.3 | 771.0 | 1,604.3 | 1,540.7 | 1,814.3 | 2,136.4 | 2,515.8 | 2,962.5 |
| Accounts Payable, % | 31.74 | 23.34 | 26.21 | 24.64 | 34.42 | 28.07 | 28.07 | 28.07 | 28.07 | 28.07 |
| Capital Expenditure | -302.9 | -307.8 | -300.8 | -469.2 | -385.1 | -598.9 | -705.2 | -830.5 | -977.9 | -1,151.6 |
| Capital Expenditure, % | -11.68 | -9.48 | -10.13 | -15 | -8.26 | -10.91 | -10.91 | -10.91 | -10.91 | -10.91 |
| Tax Rate, % | 6.15 | 6.15 | 6.15 | 6.15 | 6.15 | 6.15 | 6.15 | 6.15 | 6.15 | 6.15 |
| EBITAT | 217.2 | 354.7 | 227.6 | 281.8 | 578.9 | 529.0 | 622.9 | 733.5 | 863.7 | 1,017.1 |
| Depreciation | ||||||||||
| Changes in Account Receivables | ||||||||||
| Changes in Inventories | ||||||||||
| Changes in Accounts Payable | ||||||||||
| Capital Expenditure | ||||||||||
| UFCF | -537.1 | -36.0 | 124.5 | -484.1 | 166.9 | 8.3 | -88.7 | -104.4 | -123.0 | -144.8 |
| WACC, % | 4.66 | 4.66 | 4.65 | 4.66 | 4.66 | 4.66 | 4.66 | 4.66 | 4.66 | 4.66 |
| PV UFCF | ||||||||||
| SUM PV UFCF | -382.0 | |||||||||
| Long Term Growth Rate, % | 3.00 | |||||||||
| Free cash flow (T + 1) | -149 | |||||||||
| Terminal Value | -8,999 | |||||||||
| Present Terminal Value | -7,167 | |||||||||
| Enterprise Value | -7,549 | |||||||||
| Net Debt | -722 | |||||||||
| Equity Value | -6,828 | |||||||||
| Diluted Shares Outstanding, MM | 423 | |||||||||
| Equity Value Per Share | -16.13 |
Benefits You Will Receive
- Pre-Configured Financial Model: Utilizing Electric Connector Technology Co., Ltd. (300679SZ) actual data for accurate DCF valuation.
- Comprehensive Forecast Control: Modify revenue growth, profit margins, WACC, and other essential factors.
- Real-Time Calculations: Automatic updates allow you to view results instantly as adjustments are made.
- Professional-Grade Template: A polished Excel file tailored for high-quality valuation needs.
- Flexible and Reusable: Designed for adaptability, enabling multiple uses for in-depth forecasts.
Key Features
- Customizable Forecast Inputs: Adjust essential parameters such as revenue growth, EBITDA %, and capital expenditure for tailored insights.
- Instant DCF Valuation: Quickly computes intrinsic value, NPV, and other financial metrics at your fingertips.
- High Precision Accuracy: Leverages Electric Connector Technology Co., Ltd.'s (300679SZ) actual financial data to deliver reliable valuation results.
- Effortless Scenario Analysis: Explore various assumptions and evaluate outcomes with ease.
- Efficiency Booster: Remove the hassle of creating intricate valuation models from the ground up.
How It Works
- Download the Template: Gain immediate access to the Excel-based ECT DCF Calculator for Electric Connector Technology Co., Ltd. (300679SZ).
- Enter Your Assumptions: Modify the yellow-highlighted fields for growth rates, WACC, profit margins, and more.
- Automatic Calculations: The model refreshes to display the intrinsic value of Electric Connector Technology Co., Ltd. (300679SZ) in real-time.
- Explore Scenarios: Test various assumptions to see how they influence potential valuation outcomes.
- Evaluate and Decide: Utilize the insights gained to inform your investment or financial decisions.
Why Opt for This Calculator?
- Precise Data: Access to real-time Electric Connector Technology Co., Ltd. (300679SZ) financial information ensures trustworthy valuation outcomes.
- Flexible Options: Modify essential parameters such as growth rates, WACC, and tax rates to align with your forecasts.
- Efficiency Boost: Built-in calculations save you the hassle of starting from the ground up.
- Professional Quality: Tailored for investors, analysts, and consultants seeking in-depth insights.
- User-Friendly Design: An intuitive interface and step-by-step guidance make it accessible for all users.
Who Can Benefit from Electric Connector Technology Co., Ltd. (300679SZ)?
- Engineering Students: Explore advanced connector technologies and apply theoretical concepts using real-world data.
- Researchers: Integrate cutting-edge connector solutions into your studies or publications.
- Investors: Validate your investment strategies and evaluate performance metrics for Electric Connector Technology Co., Ltd. (300679SZ).
- Industry Analysts: Enhance your analysis with a ready-to-use, customizable financial model tailored for the electrical connector sector.
- Small Business Owners: Understand how major players like Electric Connector Technology Co., Ltd. (300679SZ) are assessed in the market.
Contents of the Template
- Pre-Filled Data: Features Electric Connector Technology Co., Ltd.'s historical financials and projections.
- Discounted Cash Flow Model: An editable DCF valuation model with automatic calculations included.
- Weighted Average Cost of Capital (WACC): A dedicated sheet for WACC calculation based on user-defined inputs.
- Key Financial Ratios: Evaluate the company’s profitability, efficiency, and leverage metrics.
- Customizable Inputs: Easily modify revenue growth, profit margins, and tax rates.
- Clear Dashboard: Visual representations and tables summarizing essential valuation outcomes.
Disclaimer
All information, articles, and product details provided on this website are for general informational and educational purposes only. We do not claim any ownership over, nor do we intend to infringe upon, any trademarks, copyrights, logos, brand names, or other intellectual property mentioned or depicted on this site. Such intellectual property remains the property of its respective owners, and any references here are made solely for identification or informational purposes, without implying any affiliation, endorsement, or partnership.
We make no representations or warranties, express or implied, regarding the accuracy, completeness, or suitability of any content or products presented. Nothing on this website should be construed as legal, tax, investment, financial, medical, or other professional advice. In addition, no part of this site—including articles or product references—constitutes a solicitation, recommendation, endorsement, advertisement, or offer to buy or sell any securities, franchises, or other financial instruments, particularly in jurisdictions where such activity would be unlawful.
All content is of a general nature and may not address the specific circumstances of any individual or entity. It is not a substitute for professional advice or services. Any actions you take based on the information provided here are strictly at your own risk. You accept full responsibility for any decisions or outcomes arising from your use of this website and agree to release us from any liability in connection with your use of, or reliance upon, the content or products found herein.