
|
Apichope Pharmaceutical Co., Ltd (300723.SZ) DCF -Bewertung |
Fully Editable: Tailor To Your Needs In Excel Or Sheets
Professional Design: Trusted, Industry-Standard Templates
Investor-Approved Valuation Models
MAC/PC Compatible, Fully Unlocked
No Expertise Is Needed; Easy To Follow
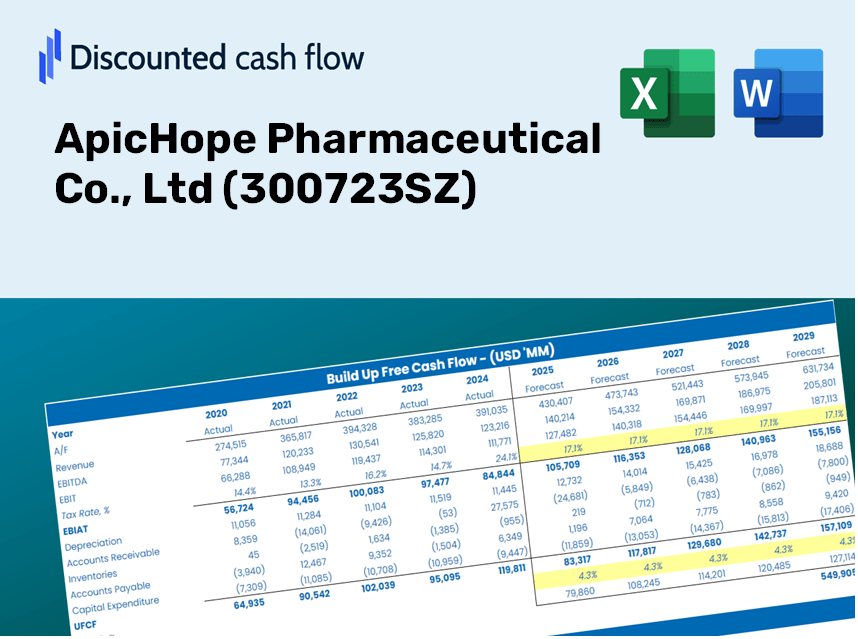
ApicHope Pharmaceutical Co., Ltd (300723.SZ) Bundle
Mit unserem (300723SZ) DCF-Taschenrechner, der für die Genauigkeit entwickelt wurde, können Sie die Bewertung von Apichope Pharmaceutical Co., Ltd unter Verwendung realer Finanzdaten bewerten und vollständige Flexibilität bieten, um alle Schlüsselparameter für verbesserte Projektionen zu ändern.
Discounted Cash Flow (DCF) - (USD MM)
| Year | AY1 2020 |
AY2 2021 |
AY3 2022 |
AY4 2023 |
AY5 2024 |
FY1 2025 |
FY2 2026 |
FY3 2027 |
FY4 2028 |
FY5 2029 |
|---|---|---|---|---|---|---|---|---|---|---|
| Revenue | 1,675.4 | 2,199.2 | 2,280.2 | 2,503.4 | 1,450.2 | 1,459.9 | 1,469.6 | 1,479.4 | 1,489.3 | 1,499.2 |
| Revenue Growth, % | 0 | 31.26 | 3.68 | 9.79 | -42.07 | 0.66655 | 0.66655 | 0.66655 | 0.66655 | 0.66655 |
| EBITDA | 225.1 | 305.8 | 366.5 | 387.3 | -115.5 | 148.7 | 149.7 | 150.6 | 151.7 | 152.7 |
| EBITDA, % | 13.43 | 13.9 | 16.07 | 15.47 | -7.97 | 10.18 | 10.18 | 10.18 | 10.18 | 10.18 |
| Depreciation | 40.7 | 49.5 | 71.9 | 158.0 | 177.9 | 77.1 | 77.6 | 78.1 | 78.7 | 79.2 |
| Depreciation, % | 2.43 | 2.25 | 3.15 | 6.31 | 12.27 | 5.28 | 5.28 | 5.28 | 5.28 | 5.28 |
| EBIT | 184.4 | 256.3 | 294.6 | 229.3 | -293.4 | 71.5 | 72.0 | 72.5 | 73.0 | 73.5 |
| EBIT, % | 11 | 11.65 | 12.92 | 9.16 | -20.23 | 4.9 | 4.9 | 4.9 | 4.9 | 4.9 |
| Total Cash | 739.0 | 1,090.1 | 717.8 | 463.0 | 473.7 | 514.8 | 518.2 | 521.7 | 525.2 | 528.7 |
| Total Cash, percent | .0 | .0 | .0 | .0 | .0 | .0 | .0 | .0 | .0 | .0 |
| Account Receivables | 292.6 | 270.6 | 410.1 | 463.9 | 362.3 | 266.5 | 268.3 | 270.0 | 271.8 | 273.7 |
| Account Receivables, % | 17.46 | 12.3 | 17.99 | 18.53 | 24.98 | 18.25 | 18.25 | 18.25 | 18.25 | 18.25 |
| Inventories | 110.1 | 115.0 | 178.0 | 346.4 | 287.1 | 155.5 | 156.5 | 157.5 | 158.6 | 159.6 |
| Inventories, % | 6.57 | 5.23 | 7.81 | 13.84 | 19.8 | 10.65 | 10.65 | 10.65 | 10.65 | 10.65 |
| Accounts Payable | 56.1 | 40.7 | 84.8 | 202.4 | 107.8 | 71.3 | 71.8 | 72.3 | 72.8 | 73.3 |
| Accounts Payable, % | 3.35 | 1.85 | 3.72 | 8.08 | 7.44 | 4.89 | 4.89 | 4.89 | 4.89 | 4.89 |
| Capital Expenditure | -314.2 | -561.2 | -605.8 | -334.5 | -319.8 | -310.2 | -312.3 | -314.4 | -316.5 | -318.6 |
| Capital Expenditure, % | -18.75 | -25.52 | -26.57 | -13.36 | -22.05 | -21.25 | -21.25 | -21.25 | -21.25 | -21.25 |
| Tax Rate, % | 16.37 | 16.37 | 16.37 | 16.37 | 16.37 | 16.37 | 16.37 | 16.37 | 16.37 | 16.37 |
| EBITAT | 152.2 | 216.8 | 262.3 | 173.4 | -245.4 | 59.4 | 59.8 | 60.2 | 60.6 | 61.0 |
| Depreciation | ||||||||||
| Changes in Account Receivables | ||||||||||
| Changes in Inventories | ||||||||||
| Changes in Accounts Payable | ||||||||||
| Capital Expenditure | ||||||||||
| UFCF | -467.8 | -293.2 | -430.0 | -107.6 | -321.0 | 17.4 | -177.1 | -178.3 | -179.5 | -180.7 |
| WACC, % | 6.43 | 6.44 | 6.45 | 6.41 | 6.43 | 6.43 | 6.43 | 6.43 | 6.43 | 6.43 |
| PV UFCF | ||||||||||
| SUM PV UFCF | -560.2 | |||||||||
| Long Term Growth Rate, % | 4.00 | |||||||||
| Free cash flow (T + 1) | -188 | |||||||||
| Terminal Value | -7,723 | |||||||||
| Present Terminal Value | -5,654 | |||||||||
| Enterprise Value | -6,214 | |||||||||
| Net Debt | 1,144 | |||||||||
| Equity Value | -7,358 | |||||||||
| Diluted Shares Outstanding, MM | 452 | |||||||||
| Equity Value Per Share | -16.29 |
What You Will Receive
- Authentic ApicHope Data: Preloaded financial metrics – from revenue to EBIT – utilizing both actual and forecasted figures.
- Comprehensive Customization: Modify all essential parameters (yellow cells) such as WACC, growth %, and tax rates.
- Real-Time Valuation Adjustments: Automatic updates to assess how changes affect ApicHope's fair value.
- Flexible Excel Template: Designed for quick modifications, scenario analyses, and in-depth projections.
- Efficiency and Precision: Avoid the hassle of building models from the ground up while ensuring accuracy and adaptability.
Key Features
- Comprehensive DCF Calculator: Offers detailed unlevered and levered DCF valuation models tailored for ApicHope Pharmaceutical Co., Ltd (300723SZ).
- WACC Calculator: Features a pre-built Weighted Average Cost of Capital spreadsheet with flexible input options.
- Customizable Forecast Assumptions: Adjust growth rates, capital expenditures, and discount rates to suit your analysis.
- Integrated Financial Ratios: Evaluate profitability, leverage, and efficiency ratios specifically for ApicHope Pharmaceutical Co., Ltd (300723SZ).
- Visual Dashboard and Charts: Graphical outputs highlight essential valuation metrics for straightforward analysis.
How It Operates
- Download the Template: Gain immediate access to the Excel-based ApicHope DCF Calculator.
- Input Your Assumptions: Modify the yellow-highlighted cells to set growth rates, WACC, margins, and other key factors.
- Instant Calculations: The model automatically recalculates the intrinsic value of ApicHope.
- Test Scenarios: Experiment with various assumptions to assess potential changes in valuation.
- Analyze and Decide: Utilize the results to inform your investment strategies or financial evaluations.
Why Choose ApicHope Pharmaceutical Co., Ltd (300723SZ)?
- Time-Saving: Skip the hassle of building financial models from scratch – our tools are ready for immediate use.
- Enhanced Accuracy: Dependable financial data and formulas minimize valuation errors.
- Completely Customizable: Adjust the model to align with your specific assumptions and forecasts.
- User-Friendly: Intuitive charts and outputs simplify the analysis of results.
- Preferred by Professionals: Created for experts who prioritize both precision and functionality.
Who Should Use This Product?
- Professional Investors: Develop precise and trustworthy valuation models for portfolio assessments related to ApicHope Pharmaceutical Co., Ltd (300723SZ).
- Corporate Finance Teams: Evaluate valuation scenarios to inform strategic planning within their organizations.
- Consultants and Advisors: Equip clients with accurate valuation insights for ApicHope Pharmaceutical Co., Ltd (300723SZ).
- Students and Educators: Leverage real-world data to enhance the learning experience in financial modeling.
- Healthcare Industry Analysts: Gain insight into how pharmaceutical companies like ApicHope are valued in the industry.
Contents of the Template
- Historical Data: Features past financial performance and baseline projections of ApicHope Pharmaceutical Co., Ltd (300723SZ).
- DCF and Levered DCF Models: Comprehensive templates for calculating the intrinsic value of ApicHope Pharmaceutical Co., Ltd (300723SZ).
- WACC Sheet: Pre-constructed calculations for the Weighted Average Cost of Capital.
- Editable Inputs: Adjust essential drivers such as growth rates, EBITDA percentages, and CAPEX assumptions.
- Quarterly and Annual Statements: A thorough analysis of ApicHope Pharmaceutical Co., Ltd (300723SZ) financials.
- Interactive Dashboard: Dynamic visualization of valuation results and projections.
Disclaimer
All information, articles, and product details provided on this website are for general informational and educational purposes only. We do not claim any ownership over, nor do we intend to infringe upon, any trademarks, copyrights, logos, brand names, or other intellectual property mentioned or depicted on this site. Such intellectual property remains the property of its respective owners, and any references here are made solely for identification or informational purposes, without implying any affiliation, endorsement, or partnership.
We make no representations or warranties, express or implied, regarding the accuracy, completeness, or suitability of any content or products presented. Nothing on this website should be construed as legal, tax, investment, financial, medical, or other professional advice. In addition, no part of this site—including articles or product references—constitutes a solicitation, recommendation, endorsement, advertisement, or offer to buy or sell any securities, franchises, or other financial instruments, particularly in jurisdictions where such activity would be unlawful.
All content is of a general nature and may not address the specific circumstances of any individual or entity. It is not a substitute for professional advice or services. Any actions you take based on the information provided here are strictly at your own risk. You accept full responsibility for any decisions or outcomes arising from your use of this website and agree to release us from any liability in connection with your use of, or reliance upon, the content or products found herein.