
|
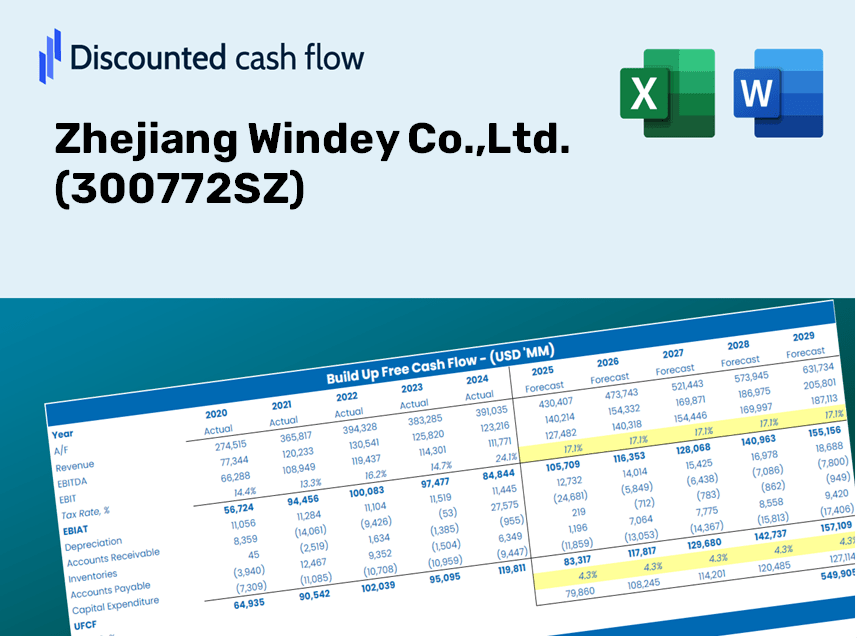
Zhejiang Windey Co., Ltd. (300772.SZ) DCF -Bewertung |
Fully Editable: Tailor To Your Needs In Excel Or Sheets
Professional Design: Trusted, Industry-Standard Templates
Investor-Approved Valuation Models
MAC/PC Compatible, Fully Unlocked
No Expertise Is Needed; Easy To Follow
Zhejiang Windey Co.,Ltd. (300772.SZ) Bundle
Möchten Sie den inneren Wert von Zhejiang Windey Co., Ltd., bestimmen? Unser (300772SZ) DCF -Taschenrechner integriert tatsächliche Marktdaten mit umfangreichen Anpassungsfunktionen, sodass Sie Ihre Projektionen verfeinern und fundiertere Investitionsentscheidungen treffen können.
Discounted Cash Flow (DCF) - (USD MM)
| Year | AY1 2020 |
AY2 2021 |
AY3 2022 |
AY4 2023 |
AY5 2024 |
FY1 2025 |
FY2 2026 |
FY3 2027 |
FY4 2028 |
FY5 2029 |
|---|---|---|---|---|---|---|---|---|---|---|
| Revenue | 11,477.9 | 16,161.3 | 17,383.9 | 18,726.7 | 22,198.1 | 22,260.5 | 22,323.1 | 22,385.9 | 22,448.9 | 22,512.0 |
| Revenue Growth, % | 0 | 40.8 | 7.57 | 7.72 | 18.54 | 0.28122 | 0.28122 | 0.28122 | 0.28122 | 0.28122 |
| EBITDA | 108.9 | 668.6 | 639.5 | 509.4 | 615.9 | 634.8 | 636.6 | 638.4 | 640.2 | 642.0 |
| EBITDA, % | 0.94894 | 4.14 | 3.68 | 2.72 | 2.77 | 2.85 | 2.85 | 2.85 | 2.85 | 2.85 |
| Depreciation | 72.9 | 108.6 | 139.4 | 167.4 | 205.6 | 174.9 | 175.4 | 175.9 | 176.4 | 176.9 |
| Depreciation, % | 0.63474 | 0.67213 | 0.80161 | 0.89403 | 0.92598 | 0.7857 | 0.7857 | 0.7857 | 0.7857 | 0.7857 |
| EBIT | 36.1 | 559.9 | 500.2 | 341.9 | 410.4 | 459.9 | 461.2 | 462.5 | 463.8 | 465.1 |
| EBIT, % | 0.3142 | 3.46 | 2.88 | 1.83 | 1.85 | 2.07 | 2.07 | 2.07 | 2.07 | 2.07 |
| Total Cash | 3,499.6 | 4,835.7 | 6,301.3 | 5,334.6 | 6,839.6 | 6,943.4 | 6,962.9 | 6,982.5 | 7,002.2 | 7,021.9 |
| Total Cash, percent | .0 | .0 | .0 | .0 | .0 | .0 | .0 | .0 | .0 | .0 |
| Account Receivables | 4,064.4 | 7,397.7 | 7,789.4 | 9,262.3 | 10,662.5 | 9,949.9 | 9,977.9 | 10,005.9 | 10,034.1 | 10,062.3 |
| Account Receivables, % | 35.41 | 45.77 | 44.81 | 49.46 | 48.03 | 44.7 | 44.7 | 44.7 | 44.7 | 44.7 |
| Inventories | 3,746.8 | 6,163.0 | 5,915.7 | 7,207.5 | 5,997.0 | 7,582.4 | 7,603.8 | 7,625.1 | 7,646.6 | 7,668.1 |
| Inventories, % | 32.64 | 38.13 | 34.03 | 38.49 | 27.02 | 34.06 | 34.06 | 34.06 | 34.06 | 34.06 |
| Accounts Payable | 9,595.1 | 15,198.0 | 15,810.1 | 18,009.5 | 17,570.4 | 19,763.2 | 19,818.8 | 19,874.5 | 19,930.4 | 19,986.4 |
| Accounts Payable, % | 83.6 | 94.04 | 90.95 | 96.17 | 79.15 | 88.78 | 88.78 | 88.78 | 88.78 | 88.78 |
| Capital Expenditure | -589.2 | -1,114.3 | -1,297.6 | -1,597.7 | -1,571.7 | -1,562.9 | -1,567.3 | -1,571.7 | -1,576.1 | -1,580.6 |
| Capital Expenditure, % | -5.13 | -6.9 | -7.46 | -8.53 | -7.08 | -7.02 | -7.02 | -7.02 | -7.02 | -7.02 |
| Tax Rate, % | 10.81 | 10.81 | 10.81 | 10.81 | 10.81 | 10.81 | 10.81 | 10.81 | 10.81 | 10.81 |
| EBITAT | 41.5 | 542.0 | 508.9 | 335.2 | 366.0 | 445.2 | 446.5 | 447.7 | 449.0 | 450.3 |
| Depreciation | ||||||||||
| Changes in Account Receivables | ||||||||||
| Changes in Inventories | ||||||||||
| Changes in Accounts Payable | ||||||||||
| Capital Expenditure | ||||||||||
| UFCF | 1,309.1 | -610.4 | -181.5 | -1,660.5 | -1,629.0 | 377.2 | -939.2 | -941.8 | -944.4 | -947.1 |
| WACC, % | 4.65 | 4.62 | 4.65 | 4.63 | 4.56 | 4.62 | 4.62 | 4.62 | 4.62 | 4.62 |
| PV UFCF | ||||||||||
| SUM PV UFCF | -2,863.7 | |||||||||
| Long Term Growth Rate, % | 3.00 | |||||||||
| Free cash flow (T + 1) | -976 | |||||||||
| Terminal Value | -60,160 | |||||||||
| Present Terminal Value | -47,995 | |||||||||
| Enterprise Value | -50,859 | |||||||||
| Net Debt | -3,583 | |||||||||
| Equity Value | -47,276 | |||||||||
| Diluted Shares Outstanding, MM | 701 | |||||||||
| Equity Value Per Share | -67.43 |
Benefits You Will Receive
- Authentic 300772SZ Financial Data: Pre-loaded with Zhejiang Windey’s historical and predictive data for accurate analysis.
- Fully Customizable Template: Effortlessly adjust key inputs such as revenue growth, WACC, and EBITDA percentage.
- Instant Calculations: Watch as the intrinsic value of Zhejiang Windey updates immediately with your modifications.
- Expert Valuation Tool: Tailored for investors, analysts, and consultants who demand precise DCF results.
- User-Friendly Interface: Intuitive layout and straightforward guidelines suitable for all skill levels.
Key Features
- 🔍 Real-Life 300772SZ Financials: Pre-populated historical and projected data for Zhejiang Windey Co., Ltd.
- ✏️ Fully Customizable Inputs: Modify all essential parameters (yellow cells) such as WACC, growth %, and tax rates.
- 📊 Professional DCF Valuation: Integrated formulas determine Zhejiang Windey’s intrinsic value using the Discounted Cash Flow method.
- ⚡ Instant Results: Immediately visualize Zhejiang Windey’s valuation after adjusting inputs.
- Scenario Analysis: Evaluate and contrast outcomes for different financial assumptions side-by-side.
How It Works
- Step 1: Download the Excel file.
- Step 2: Review the pre-populated data for Zhejiang Windey Co., Ltd. (300772SZ), including historical and forecasted figures.
- Step 3: Modify key assumptions (yellow cells) according to your insights.
- Step 4: Observe the automatic recalculation of Zhejiang Windey’s intrinsic value.
- Step 5: Utilize the results for making investment decisions or for reporting purposes.
Why Opt for This Calculator?
- All-in-One Solution: Features DCF, WACC, and financial ratio analysis seamlessly integrated.
- Flexible Input Options: Modify the yellow-highlighted fields to explore different scenarios.
- In-Depth Analysis: Automatically computes the intrinsic value and Net Present Value for Zhejiang Windey Co., Ltd. (300772SZ).
- Built-In Data: Includes historical and projected data for precise baseline calculations.
- Top-Tier Quality: Perfect for financial analysts, investors, and business consultants alike.
Who Should Utilize This Product?
- Individual Investors: Gain insights to make educated decisions regarding investments in Zhejiang Windey Co., Ltd. (300772SZ).
- Financial Analysts: Enhance valuation methods with readily available financial models tailored for Zhejiang Windey Co., Ltd. (300772SZ).
- Consultants: Provide clients with accurate and timely valuation insights for Zhejiang Windey Co., Ltd. (300772SZ).
- Business Owners: Learn how major companies like Zhejiang Windey Co., Ltd. (300772SZ) are valued to inform your business strategies.
- Finance Students: Explore valuation practices using real-world data and case studies related to Zhejiang Windey Co., Ltd. (300772SZ).
What the Template Includes
- Preloaded 300772SZ Data: Historical and projected financial information such as revenue, EBIT, and capital expenditures.
- DCF and WACC Models: High-quality sheets designed for calculating intrinsic value and Weighted Average Cost of Capital.
- Editable Inputs: Yellow-highlighted fields for modifying revenue growth, tax rates, and discount rates.
- Financial Statements: Detailed annual and quarterly financials for in-depth analysis.
- Key Ratios: Ratios related to profitability, leverage, and efficiency for performance evaluation.
- Dashboard and Charts: Visual representations of valuation results and underlying assumptions.
Disclaimer
All information, articles, and product details provided on this website are for general informational and educational purposes only. We do not claim any ownership over, nor do we intend to infringe upon, any trademarks, copyrights, logos, brand names, or other intellectual property mentioned or depicted on this site. Such intellectual property remains the property of its respective owners, and any references here are made solely for identification or informational purposes, without implying any affiliation, endorsement, or partnership.
We make no representations or warranties, express or implied, regarding the accuracy, completeness, or suitability of any content or products presented. Nothing on this website should be construed as legal, tax, investment, financial, medical, or other professional advice. In addition, no part of this site—including articles or product references—constitutes a solicitation, recommendation, endorsement, advertisement, or offer to buy or sell any securities, franchises, or other financial instruments, particularly in jurisdictions where such activity would be unlawful.
All content is of a general nature and may not address the specific circumstances of any individual or entity. It is not a substitute for professional advice or services. Any actions you take based on the information provided here are strictly at your own risk. You accept full responsibility for any decisions or outcomes arising from your use of this website and agree to release us from any liability in connection with your use of, or reliance upon, the content or products found herein.