
|
Qingdao Huicheng Environmental Technology Group Co., Ltd. (300779.SZ) DCF -Bewertung |
Fully Editable: Tailor To Your Needs In Excel Or Sheets
Professional Design: Trusted, Industry-Standard Templates
Investor-Approved Valuation Models
MAC/PC Compatible, Fully Unlocked
No Expertise Is Needed; Easy To Follow
Qingdao Huicheng Environmental Technology Group Co., Ltd. (300779.SZ) Bundle
Entdecken Sie das wahre Potenzial von Qingdao Huicheng Environmental Technology Group Co., Ltd. (300779SZ) mit unserem fortschrittlichen DCF -Taschenrechner! Passen Sie wesentliche Annahmen an, erkunden Sie verschiedene Szenarien und bewerten Sie, wie unterschiedliche Faktoren die Bewertung der Qingdao Huicheng Environmental Technology Group Co., Ltd. (300779SZ) beeinflussen - alles innerhalb einer einzigen Excel -Vorlage.
Benefits of Our Offering
- Integrated Financial Model: Leverage Qingdao Huicheng's actual data for accurate DCF assessment.
- Comprehensive Forecast Management: Easily modify revenue growth, profit margins, WACC, and other critical factors.
- Real-Time Calculations: Automatic updates provide immediate feedback as you adjust inputs.
- Professional-Grade Template: A polished Excel file tailored for high-quality valuation presentations.
- Flexible and Reusable: Designed for adaptability, enabling multiple uses for in-depth forecasting.
Key Features
- Accurate Historical Data: Gain access to reliable pre-loaded financial information and future forecasts for Qingdao Huicheng Environmental Technology Group Co., Ltd. (300779SZ).
- Adjustable Forecast Inputs: Modify highlighted cells for critical variables such as WACC, growth rates, and profit margins.
- Real-Time Calculations: Automatic recalculations for DCF, Net Present Value (NPV), and cash flow analyses.
- User-Friendly Dashboard: Clear and concise visualizations to help interpret your valuation outcomes.
- Designed for All Experience Levels: An intuitive layout tailored for investors, CFOs, and consultants alike.
How It Functions
- Download: Obtain the pre-prepared Excel file containing Qingdao Huicheng Environmental Technology Group Co., Ltd.'s financial data.
- Customize: Modify projections, including revenue growth, EBITDA %, and WACC, to fit your analysis.
- Update Automatically: Watch as intrinsic value and NPV calculations refresh in real-time.
- Test Scenarios: Generate various projections and instantly compare results.
- Make Decisions: Utilize the valuation findings to inform your investment approach.
Why Opt for This Calculator?
- Precise Information: Accurate financial data from Qingdao Huicheng Environmental Technology Group Co., Ltd. ensures trustworthy valuation outcomes.
- Tailorable: Modify essential parameters such as growth rates, WACC, and tax rates to align with your forecasts.
- Efficiency: Ready-made calculations save you from starting from the ground up.
- High-Quality Tool: Crafted for use by investors, analysts, and consultants.
- Easy to Use: Simple layout and comprehensive guidance make it accessible for all users.
Who Can Benefit from This Product?
- Individual Investors: Gain insights to make proactive decisions regarding investments in Qingdao Huicheng Environmental Technology Group Co., Ltd. (300779SZ).
- Financial Analysts: Enhance your valuation processes with comprehensive financial models tailored for (300779SZ).
- Consultants: Provide clients with accurate and timely valuation analyses for (300779SZ).
- Business Owners: Learn how companies like Qingdao Huicheng Environmental Technology Group Co., Ltd. (300779SZ) are valued to better inform your own business strategies.
- Finance Students: Acquire practical valuation skills using real market data from (300779SZ) and similar firms.
What the Template Includes
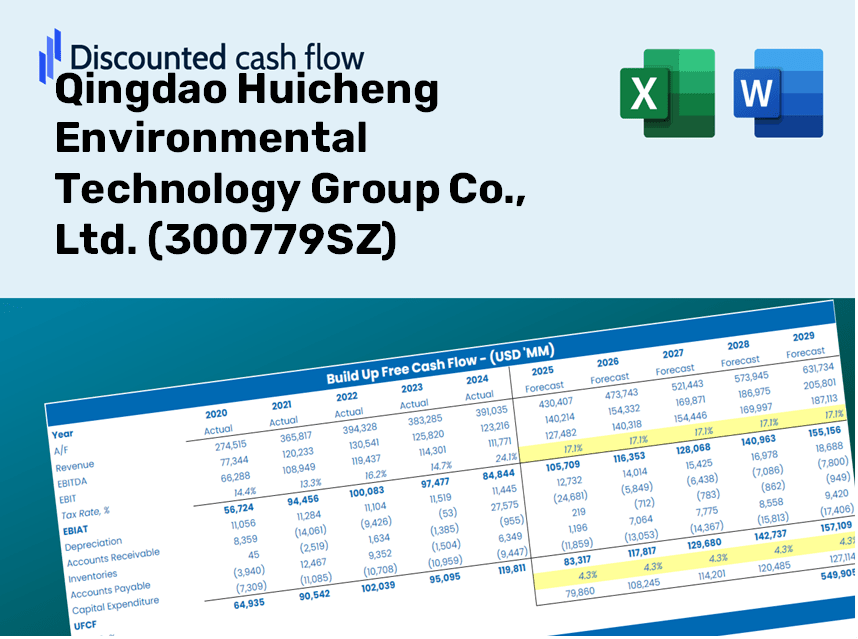
- Preloaded 300779SZ Data: Historical and projected financial information, encompassing revenue, EBIT, and capital expenditures.
- DCF and WACC Models: Advanced sheets designed for calculating intrinsic value and the Weighted Average Cost of Capital.
- Editable Inputs: Yellow-highlighted cells for modifying revenue growth, tax rates, and discount rates.
- Financial Statements: Detailed annual and quarterly financials for comprehensive analysis.
- Key Ratios: Metrics on profitability, leverage, and efficiency to assess overall performance.
- Dashboard and Charts: Visual representations of valuation results and underlying assumptions.
Disclaimer
All information, articles, and product details provided on this website are for general informational and educational purposes only. We do not claim any ownership over, nor do we intend to infringe upon, any trademarks, copyrights, logos, brand names, or other intellectual property mentioned or depicted on this site. Such intellectual property remains the property of its respective owners, and any references here are made solely for identification or informational purposes, without implying any affiliation, endorsement, or partnership.
We make no representations or warranties, express or implied, regarding the accuracy, completeness, or suitability of any content or products presented. Nothing on this website should be construed as legal, tax, investment, financial, medical, or other professional advice. In addition, no part of this site—including articles or product references—constitutes a solicitation, recommendation, endorsement, advertisement, or offer to buy or sell any securities, franchises, or other financial instruments, particularly in jurisdictions where such activity would be unlawful.
All content is of a general nature and may not address the specific circumstances of any individual or entity. It is not a substitute for professional advice or services. Any actions you take based on the information provided here are strictly at your own risk. You accept full responsibility for any decisions or outcomes arising from your use of this website and agree to release us from any liability in connection with your use of, or reliance upon, the content or products found herein.