
|
Guangzhou Haoyang Electronic Co., Ltd. (300833.SZ) DCF -Bewertung |
Fully Editable: Tailor To Your Needs In Excel Or Sheets
Professional Design: Trusted, Industry-Standard Templates
Investor-Approved Valuation Models
MAC/PC Compatible, Fully Unlocked
No Expertise Is Needed; Easy To Follow
Guangzhou Haoyang Electronic Co.,Ltd. (300833.SZ) Bundle
Entdecken Sie das wahre Potenzial von Guangzhou Haoyang Electronic Co., Ltd. (300833SZ) mit unserem erweiterten DCF -Taschenrechner! Passen Sie die wichtigsten Annahmen an, erkunden Sie verschiedene Szenarien und bewerten Sie, wie unterschiedliche Änderungen die Bewertung von Guangzhou Haoyang Electronic Co., Ltd. (300833SZ) - Alles innerhalb einer bequemen Excel -Vorlage.
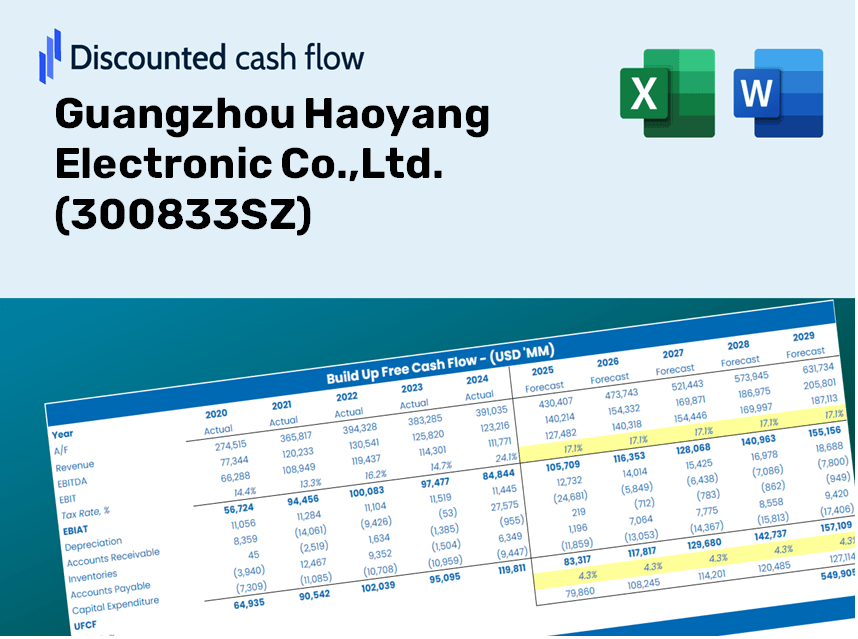
Discounted Cash Flow (DCF) - (USD MM)
| Year | AY1 2020 |
AY2 2021 |
AY3 2022 |
AY4 2023 |
AY5 2024 |
FY1 2025 |
FY2 2026 |
FY3 2027 |
FY4 2028 |
FY5 2029 |
|---|---|---|---|---|---|---|---|---|---|---|
| Revenue | 399.7 | 618.1 | 1,222.7 | 1,304.9 | 1,212.0 | 1,199.0 | 1,186.2 | 1,173.6 | 1,161.0 | 1,148.6 |
| Revenue Growth, % | 0 | 54.66 | 97.8 | 6.72 | -7.12 | -1.07 | -1.07 | -1.07 | -1.07 | -1.07 |
| EBITDA | 117.3 | 177.8 | 451.9 | 474.4 | 401.6 | 394.6 | 390.4 | 386.3 | 382.1 | 378.1 |
| EBITDA, % | 29.36 | 28.77 | 36.96 | 36.35 | 33.13 | 32.91 | 32.91 | 32.91 | 32.91 | 32.91 |
| Depreciation | 14.9 | 15.6 | 20.9 | 30.6 | 38.6 | 32.4 | 32.0 | 31.7 | 31.4 | 31.0 |
| Depreciation, % | 3.74 | 2.52 | 1.71 | 2.35 | 3.19 | 2.7 | 2.7 | 2.7 | 2.7 | 2.7 |
| EBIT | 102.4 | 162.2 | 431.0 | 443.7 | 362.9 | 362.3 | 358.4 | 354.6 | 350.8 | 347.0 |
| EBIT, % | 25.62 | 26.24 | 35.25 | 34 | 29.95 | 30.21 | 30.21 | 30.21 | 30.21 | 30.21 |
| Total Cash | 1,435.2 | 1,419.4 | 1,553.2 | 1,609.0 | 1,544.8 | 1,199.0 | 1,186.2 | 1,173.6 | 1,161.0 | 1,148.6 |
| Total Cash, percent | .0 | .0 | .0 | .0 | .0 | .0 | .0 | .0 | .0 | .0 |
| Account Receivables | 98.6 | 198.0 | 171.9 | 242.8 | 268.2 | 267.4 | 264.5 | 261.7 | 258.9 | 256.1 |
| Account Receivables, % | 24.67 | 32.02 | 14.06 | 18.61 | 22.13 | 22.3 | 22.3 | 22.3 | 22.3 | 22.3 |
| Inventories | 136.6 | 251.2 | 295.6 | 185.7 | 271.7 | 325.3 | 321.8 | 318.4 | 315.0 | 311.6 |
| Inventories, % | 34.18 | 40.64 | 24.17 | 14.23 | 22.42 | 27.13 | 27.13 | 27.13 | 27.13 | 27.13 |
| Accounts Payable | 24.1 | 120.6 | 128.4 | 149.3 | 159.0 | 145.3 | 143.8 | 142.3 | 140.7 | 139.2 |
| Accounts Payable, % | 6.03 | 19.52 | 10.5 | 11.44 | 13.12 | 12.12 | 12.12 | 12.12 | 12.12 | 12.12 |
| Capital Expenditure | -14.0 | -33.9 | -183.2 | -147.6 | -131.2 | -110.5 | -109.3 | -108.2 | -107.0 | -105.9 |
| Capital Expenditure, % | -3.49 | -5.48 | -14.98 | -11.31 | -10.82 | -9.22 | -9.22 | -9.22 | -9.22 | -9.22 |
| Tax Rate, % | 16.5 | 16.5 | 16.5 | 16.5 | 16.5 | 16.5 | 16.5 | 16.5 | 16.5 | 16.5 |
| EBITAT | 88.4 | 136.1 | 357.1 | 368.0 | 303.0 | 303.9 | 300.7 | 297.5 | 294.3 | 291.2 |
| Depreciation | ||||||||||
| Changes in Account Receivables | ||||||||||
| Changes in Inventories | ||||||||||
| Changes in Accounts Payable | ||||||||||
| Capital Expenditure | ||||||||||
| UFCF | -121.7 | .4 | 184.2 | 310.9 | 108.8 | 159.4 | 228.2 | 225.7 | 223.3 | 220.9 |
| WACC, % | 7.48 | 7.48 | 7.48 | 7.48 | 7.48 | 7.48 | 7.48 | 7.48 | 7.48 | 7.48 |
| PV UFCF | ||||||||||
| SUM PV UFCF | 849.1 | |||||||||
| Long Term Growth Rate, % | 3.50 | |||||||||
| Free cash flow (T + 1) | 229 | |||||||||
| Terminal Value | 5,746 | |||||||||
| Present Terminal Value | 4,006 | |||||||||
| Enterprise Value | 4,856 | |||||||||
| Net Debt | -824 | |||||||||
| Equity Value | 5,679 | |||||||||
| Diluted Shares Outstanding, MM | 126 | |||||||||
| Equity Value Per Share | 44.90 |
What You Will Receive
- Pre-Filled Financial Model: Utilizing Guangzhou Haoyang Electronic Co., Ltd.'s (300833SZ) actual data for accurate DCF valuation.
- Comprehensive Forecast Control: Modify revenue growth, profit margins, WACC, and other crucial factors.
- Real-Time Calculations: Automatic updates provide immediate results as you adjust inputs.
- Professional-Grade Template: A polished Excel file crafted for high-quality valuation presentations.
- Flexible and Reusable: Customizable for multiple uses, enabling detailed and adapted forecasts.
Key Features
- Real-Life 300833SZ Data: Pre-populated with Guangzhou Haoyang Electronic Co., Ltd.'s historical financials and future projections.
- Fully Customizable Inputs: Tailor revenue growth, profit margins, discount rates, tax rates, and capital expenditures.
- Dynamic Valuation Model: Automatically refreshes Net Present Value (NPV) and intrinsic value based on your provided inputs.
- Scenario Testing: Develop various forecast scenarios to evaluate alternative valuation results.
- User-Friendly Design: Intuitive and organized, suitable for both professionals and novices.
How It Functions
- 1. Access the Template: Download and open the Excel file containing Guangzhou Haoyang Electronic Co., Ltd.'s preloaded data.
- 2. Adjust Assumptions: Modify essential inputs such as growth rates, WACC, and capital expenditures.
- 3. Instantly View Results: The DCF model automatically calculates intrinsic value and NPV.
- 4. Explore Scenarios: Evaluate multiple forecasts to examine various valuation results.
- 5. Utilize with Assurance: Present professional valuation insights for well-informed decision-making.
Why Opt for Our Calculator?
- All-in-One Solution: Features DCF, WACC, and financial ratio analyses seamlessly integrated.
- Customizable Variables: Modify highlighted cells to explore different scenarios easily.
- In-Depth Analysis: Automatically computes the intrinsic value and Net Present Value for Guangzhou Haoyang Electronic Co., Ltd. (300833SZ).
- Preloaded Information: Comes with historical and projected data for accurate baseline assessments.
- High-Caliber Tool: Perfect for financial analysts, investors, and business consultants looking to enhance their decision-making.
Who Can Benefit from Our Products?
- Individual Investors: Gain insights for making informed decisions on investing in Guangzhou Haoyang Electronic Co., Ltd. (300833SZ).
- Financial Analysts: Enhance your valuation processes with our comprehensive financial models tailored for Guangzhou Haoyang Electronic Co., Ltd. (300833SZ).
- Consultants: Provide accurate and timely valuation insights for your clients regarding Guangzhou Haoyang Electronic Co., Ltd. (300833SZ).
- Business Owners: Learn how to evaluate large companies like Guangzhou Haoyang Electronic Co., Ltd. (300833SZ) to inform your own business strategies.
- Finance Students: Master valuation techniques through real-world examples and data related to Guangzhou Haoyang Electronic Co., Ltd. (300833SZ).
Contents of the Template
- Operating and Balance Sheet Data: Pre-filled historical data and forecasts for Guangzhou Haoyang Electronic Co., Ltd. (300833SZ), including revenue, EBITDA, EBIT, and capital expenditures.
- WACC Calculation: A dedicated sheet for the Weighted Average Cost of Capital (WACC), featuring parameters such as Beta, risk-free rate, and share price.
- DCF Valuation (Unlevered and Levered): Editable Discounted Cash Flow models that display intrinsic value with comprehensive calculations.
- Financial Statements: Pre-loaded financial statements (both annual and quarterly) to facilitate analysis.
- Key Ratios: Includes important profitability, leverage, and efficiency ratios for Guangzhou Haoyang Electronic Co., Ltd. (300833SZ).
- Dashboard and Charts: A visual summary of valuation outputs and assumptions to simplify the analysis of results.
Disclaimer
All information, articles, and product details provided on this website are for general informational and educational purposes only. We do not claim any ownership over, nor do we intend to infringe upon, any trademarks, copyrights, logos, brand names, or other intellectual property mentioned or depicted on this site. Such intellectual property remains the property of its respective owners, and any references here are made solely for identification or informational purposes, without implying any affiliation, endorsement, or partnership.
We make no representations or warranties, express or implied, regarding the accuracy, completeness, or suitability of any content or products presented. Nothing on this website should be construed as legal, tax, investment, financial, medical, or other professional advice. In addition, no part of this site—including articles or product references—constitutes a solicitation, recommendation, endorsement, advertisement, or offer to buy or sell any securities, franchises, or other financial instruments, particularly in jurisdictions where such activity would be unlawful.
All content is of a general nature and may not address the specific circumstances of any individual or entity. It is not a substitute for professional advice or services. Any actions you take based on the information provided here are strictly at your own risk. You accept full responsibility for any decisions or outcomes arising from your use of this website and agree to release us from any liability in connection with your use of, or reliance upon, the content or products found herein.